How Can We Help?
Quick Start: Three Typical Usage Scenarios
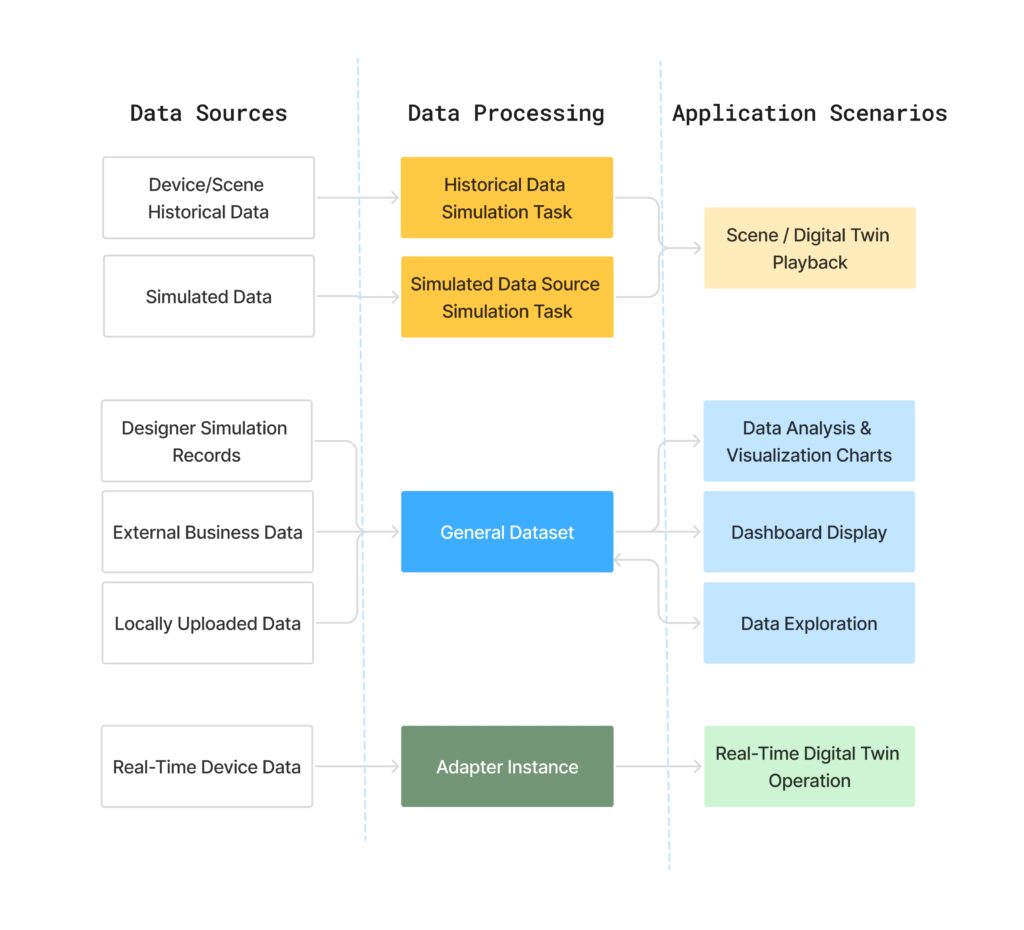
DFS provides three common workflows designed to help different user roles get started quickly:
- Historical / Simulated Data Sources – for scenario playback and simulation.
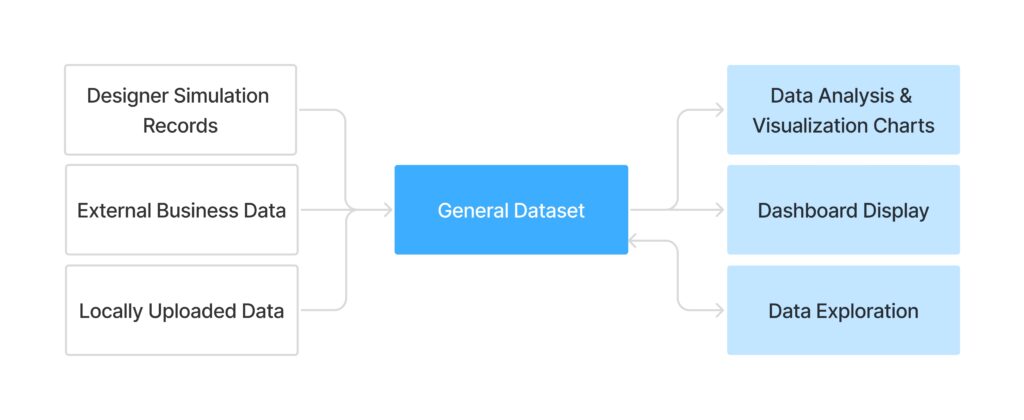
- General Datasets – for exploration, analytics, and visualization.
- Real-Time Data Sources – for live production monitoring and control.

Scenario 1 — Simulation Using Historical or Simulated Data

Who it’s for:
Users who need to replay, demonstrate, or validate system behavior within a digital-twin environment.
Data Sources
- Historical data from equipment or scenes.
- User-uploaded simulated data files.
Typical Workflow
- Build the digital-twin scene in Designer by modeling devices, environments, and interaction logic.
- Import the scene into DFS.
- Create a simulation task:
- Historical data task – Replays existing time-series data from devices or scenes (see Creating a Historical Data Source Simulation Task).
- Simulated data task – Uploads a mock data file to generate virtual device signals for testing or demos (see Creating a Simulated Data Source Simulation Task).
- Run the task from the Task List to execute and play back data.
- Drive the digital twin or scene by binding devices to their digital counterparts to verify motion and logic.
Note: Historical and simulated data sources are intended for playback and testing only. They do not generate general datasets and cannot be used directly for data exploration.
Result
- A fully replayable simulation task.
- Digital twins or scenes respond to recorded or simulated data for validation, testing, or presentation.
Scenario 2 — Exploration and Visualization with General Datasets

Who it’s for:
Users performing analytics, metric calculation, or dashboard visualization.
Data Sources
- Simulation logs automatically uploaded from Designer (converted to general datasets).
- Manually uploaded files in the General Datasets
- External enterprise data integrated via back-end connectors.
- Result datasets generated by prior data-exploration workflows.
Typical Workflow
- Start a data exploration – Design a data-processing flow using cleaning, feature extraction, and computation nodes.
- Publish the exploration method – When similar datasets are uploaded, the workflow executes automatically to generate result datasets.
- Configure and publish dashboards – Visualize outputs that auto-refresh as new data arrives.
Note: General datasets are used for analytics and visualization only; they are not valid as historical-data sources.
Result
- A general dataset automatically produced after each simulation run.
- Automated execution of exploration workflows.
- Dashboards update dynamically, enabling simultaneous 3D playback and analytical insight—closing the loop from simulation to decision.
Scenario 3 — Real-Time Device Integration (Production Environment)

Who it’s for:
Users with physical equipment or control systems requiring live twin synchronization and monitoring.
Data Sources
- Real-time data streams from IoT devices, sensors, or enterprise systems.
Typical Workflow
- Create an Adapter Instance – Configure data-source connections on the Adapter Instance page (see Creating an Adapter Instance).
- Design a Node-RED flow – Define logic for data acquisition, cleansing, and forwarding (see Editing Node-RED Flows).
- Bind devices to digital twins – Map incoming data fields to twin attributes (see Binding Devices and Digital Twins).
- Run real-time visualization in Designer to verify live data response.
- Monitor and operate via Designer or custom dashboards for live supervision and alerts.
Result
- A real-time, data-driven digital-twin environment.
- Continuous monitoring, maintenance, and alerting in live production settings.