
Building energy and EUI review
Compare energy use by building, floor, zone, system, meter, operating schedule, and weather condition.
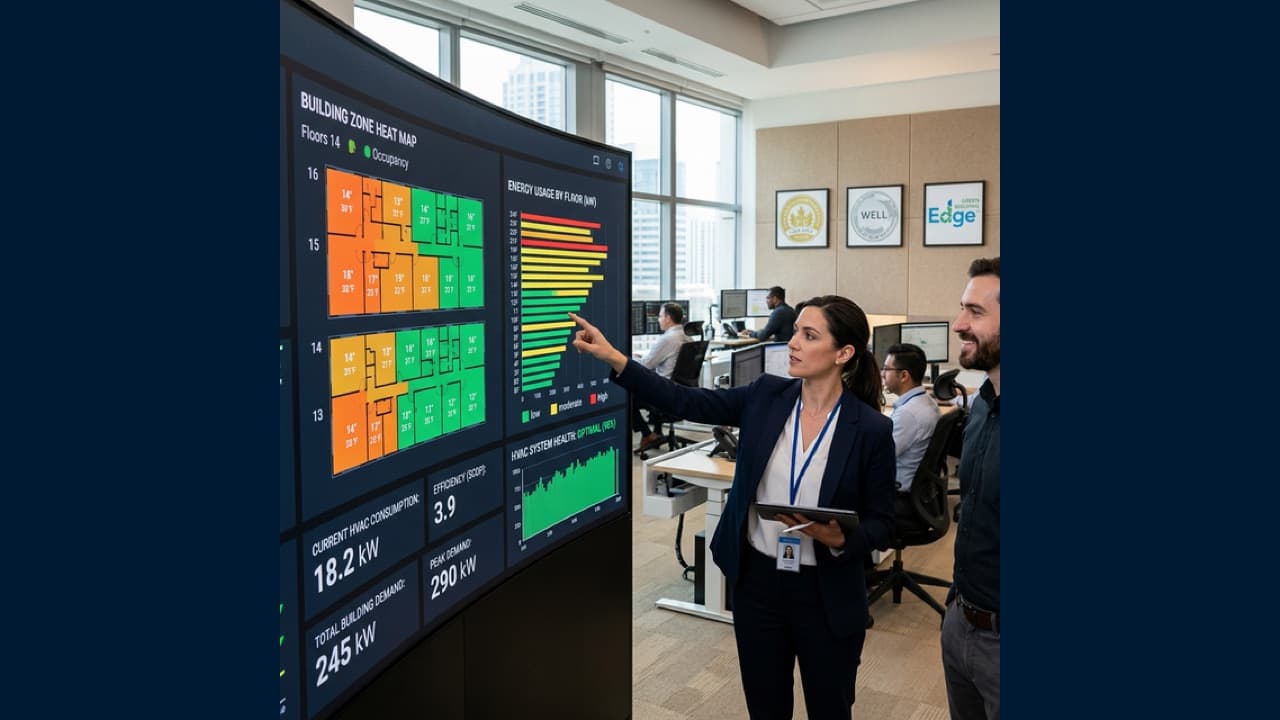
Connect energy insight with operational action
Connect BMS, meters, equipment condition, operating schedules, weather, spaces, and maintenance actions for energy analysis, EnergyPlus scenario comparison, Green Mark readiness, and traceable improvement work.
Connect data, workflows, and field execution so teams can understand context, act faster, and keep work traceable.
Relate electricity, cooling, HVAC, lighting, compressed air, water, and other utilities to sites, spaces, systems, equipment, schedules, and weather.
Organize buildings, zones, equipment, meters, sensors, and control points with consistent relationships that support analysis and evidence review.
Review abnormal consumption, control drift, schedule mismatch, equipment condition, and cross-system behavior using live and historical data.
Combine BIM or IFC data, weather, operating records, and building-energy models to compare selected operating and retrofit scenarios.
Organize EUI, envelope, system, maintenance, assessment, and corrective records for project teams preparing Singapore Green Mark review materials.
Move validated opportunities into Inspector inspections, work orders, approvals, field evidence, and follow-up measurement.
Practical applications and proven success scenarios across industries.
Compare energy use by building, floor, zone, system, meter, operating schedule, and weather condition.

Investigate cooling, air handling, compressed air, electrical distribution, and other energy-intensive facility systems.

Keep energy, envelope, asset, inspection, maintenance, assessment, and corrective-action records connected to the relevant building and system.

Use measured baselines and project-configured EnergyPlus models to compare selected equipment, setpoint, schedule, envelope, or space-use changes.

Assign investigation and corrective work, capture field evidence, and review the operating record after changes are implemented.
Energy performance changes with equipment condition, schedules, controls, weather, occupancy, maintenance quality, and how spaces are used. A useful energy program connects those factors to the teams and work required to improve them.
DataMesh brings BMS, meters, IoT, historians, BIM or IFC, maintenance records, and work orders into an operational digital twin. Facility and engineering teams can establish baselines, investigate abnormal consumption, compare selected scenarios, execute corrective work, and retain the resulting evidence.
Data Fusion Services connects multi-vendor control systems, meters, sensors, databases, and enterprise applications. FactVerse maps the data to sites, spaces, systems, equipment, and operating relationships.
Inspector can use Brick Schema-aligned semantics for buildings, floors, zones, equipment, meters, sensors, and control points. This shared structure helps teams trace an energy exception, analysis input, or assessment record to the relevant asset and source data.
Energy review can combine load, weather, occupancy, schedules, setpoints, equipment status, alarms, and maintenance history. Teams can examine high-load periods, drifting controls, simultaneous heating and cooling, equipment degradation, schedule mismatch, and cross-system behavior.
FactVerse AI Agent can assist with trend review and anomaly interpretation using the available facility context. Engineers validate the data, method, assumptions, and recommended action for the project.
When a decision needs deeper building-energy analysis, project teams can combine BIM or IFC data, weather, operating records, and EnergyPlus-based models. Scenario comparison may cover operating schedules, setpoints, equipment changes, envelope options, or space-use assumptions.
The model scope, calibration approach, input quality, and decision criteria are defined for each project. Results become part of the review record used to prioritize and approve improvement work.
Singapore Green Mark work draws on energy performance, building envelope, system information, maintainability, operating records, and assessment material. DataMesh helps teams organize EUI and envelope inputs, building and system relationships, assessment history, maintenance evidence, and corrective actions around the relevant site.
The resulting record supports collaboration among owners, facility teams, engineers, appointed consultants, and assessors through the applicable BCA process.
Inspector carries an approved opportunity into inspection, assignment, work order, field execution, evidence capture, and follow-up measurement. Teams can see which action was taken, who completed it, what evidence was collected, and how operating conditions changed afterward.
Begin with one building, system group, or operating problem where source data and ownership are clear. Establish the baseline, validate asset and meter relationships, investigate the selected condition, execute agreed actions, and review the result before extending the program.
Projects commonly combine BMS, meters, IoT, historians, weather, operating schedules, equipment status, maintenance records, BIM or IFC, and relevant business data.
Brick-aligned relationships give buildings, zones, equipment, meters, sensors, and control points a consistent semantic structure. This makes analysis and evidence easier to trace to the correct system and asset.
EnergyPlus supports project-configured building-energy modeling and scenario comparison. Model inputs, assumptions, calibration, and results are reviewed against the data and decision required by the project.
It helps project teams organize operating data, EUI and envelope inputs, assessment history, maintenance evidence, and corrective records for review with the appointed professionals and BCA process.
Establish a measured baseline, validate the data and analysis method, prioritize feasible actions, and set targets from the verified operating record and approved project assumptions.
Continue with the most relevant products, solutions, guides, and public references for this topic.