How Can We Help?
User interface
Homepage
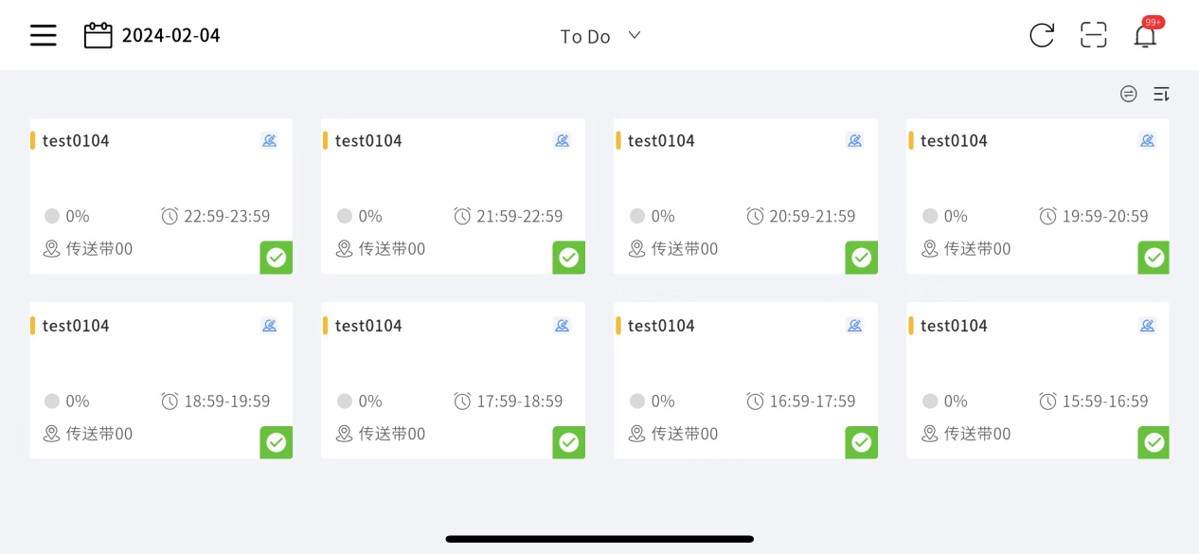
The homepage of DataMesh Checklist can be divided into two sections: the menus and the task bucket.
Menus

Function menu button: This button serves to expand and collapse the function menu.
Calendar: You can select a specific day to view the tasks scheduled for that day.
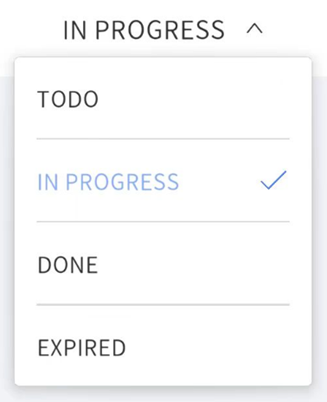
Task status: There are four task statuses available.
-
- TO DO: Tasks that are yet to reach their start time.
- IN PROGRESS: Tasks that are currently being executed within their validity period.
- DONE: Tasks that have been executed within the validity period.
- EXPIRED: Tasks that were not executed and have passed their validity period.
Refresh: This button allows you to synchronize with the server, refresh the task bucket, and upload any task records that failed to upload successfully.
Scan: Use this feature to scan the QR code of equipment and access details and related tasks for that device.
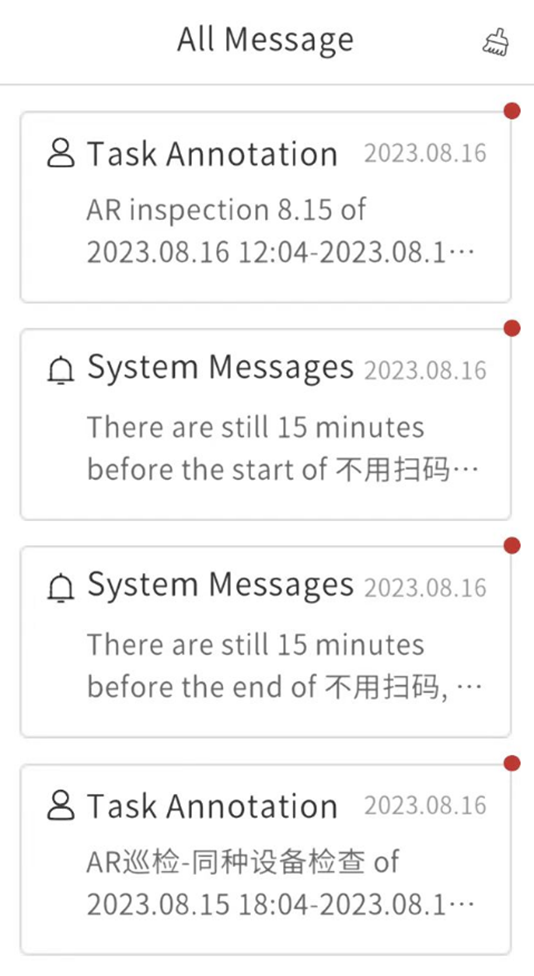
Messages: This section encompasses task annotations and system messages. Task annotations are comments provided by supervisors in the inspection records. System messages include information about task and equipment inspections, such as reminders for task start or end times, equipment anomalies, and inspection record upload results. Task performers will receive messages regarding task annotations and start/end time reminders, as well as inspection record upload status. Task creators will receive messages about equipment anomalies. Click the button ![]() to expand the message list, click on a message to view its details. Click the
to expand the message list, click on a message to view its details. Click the ![]() button to Mark All as Read.
button to Mark All as Read.
Task bucket
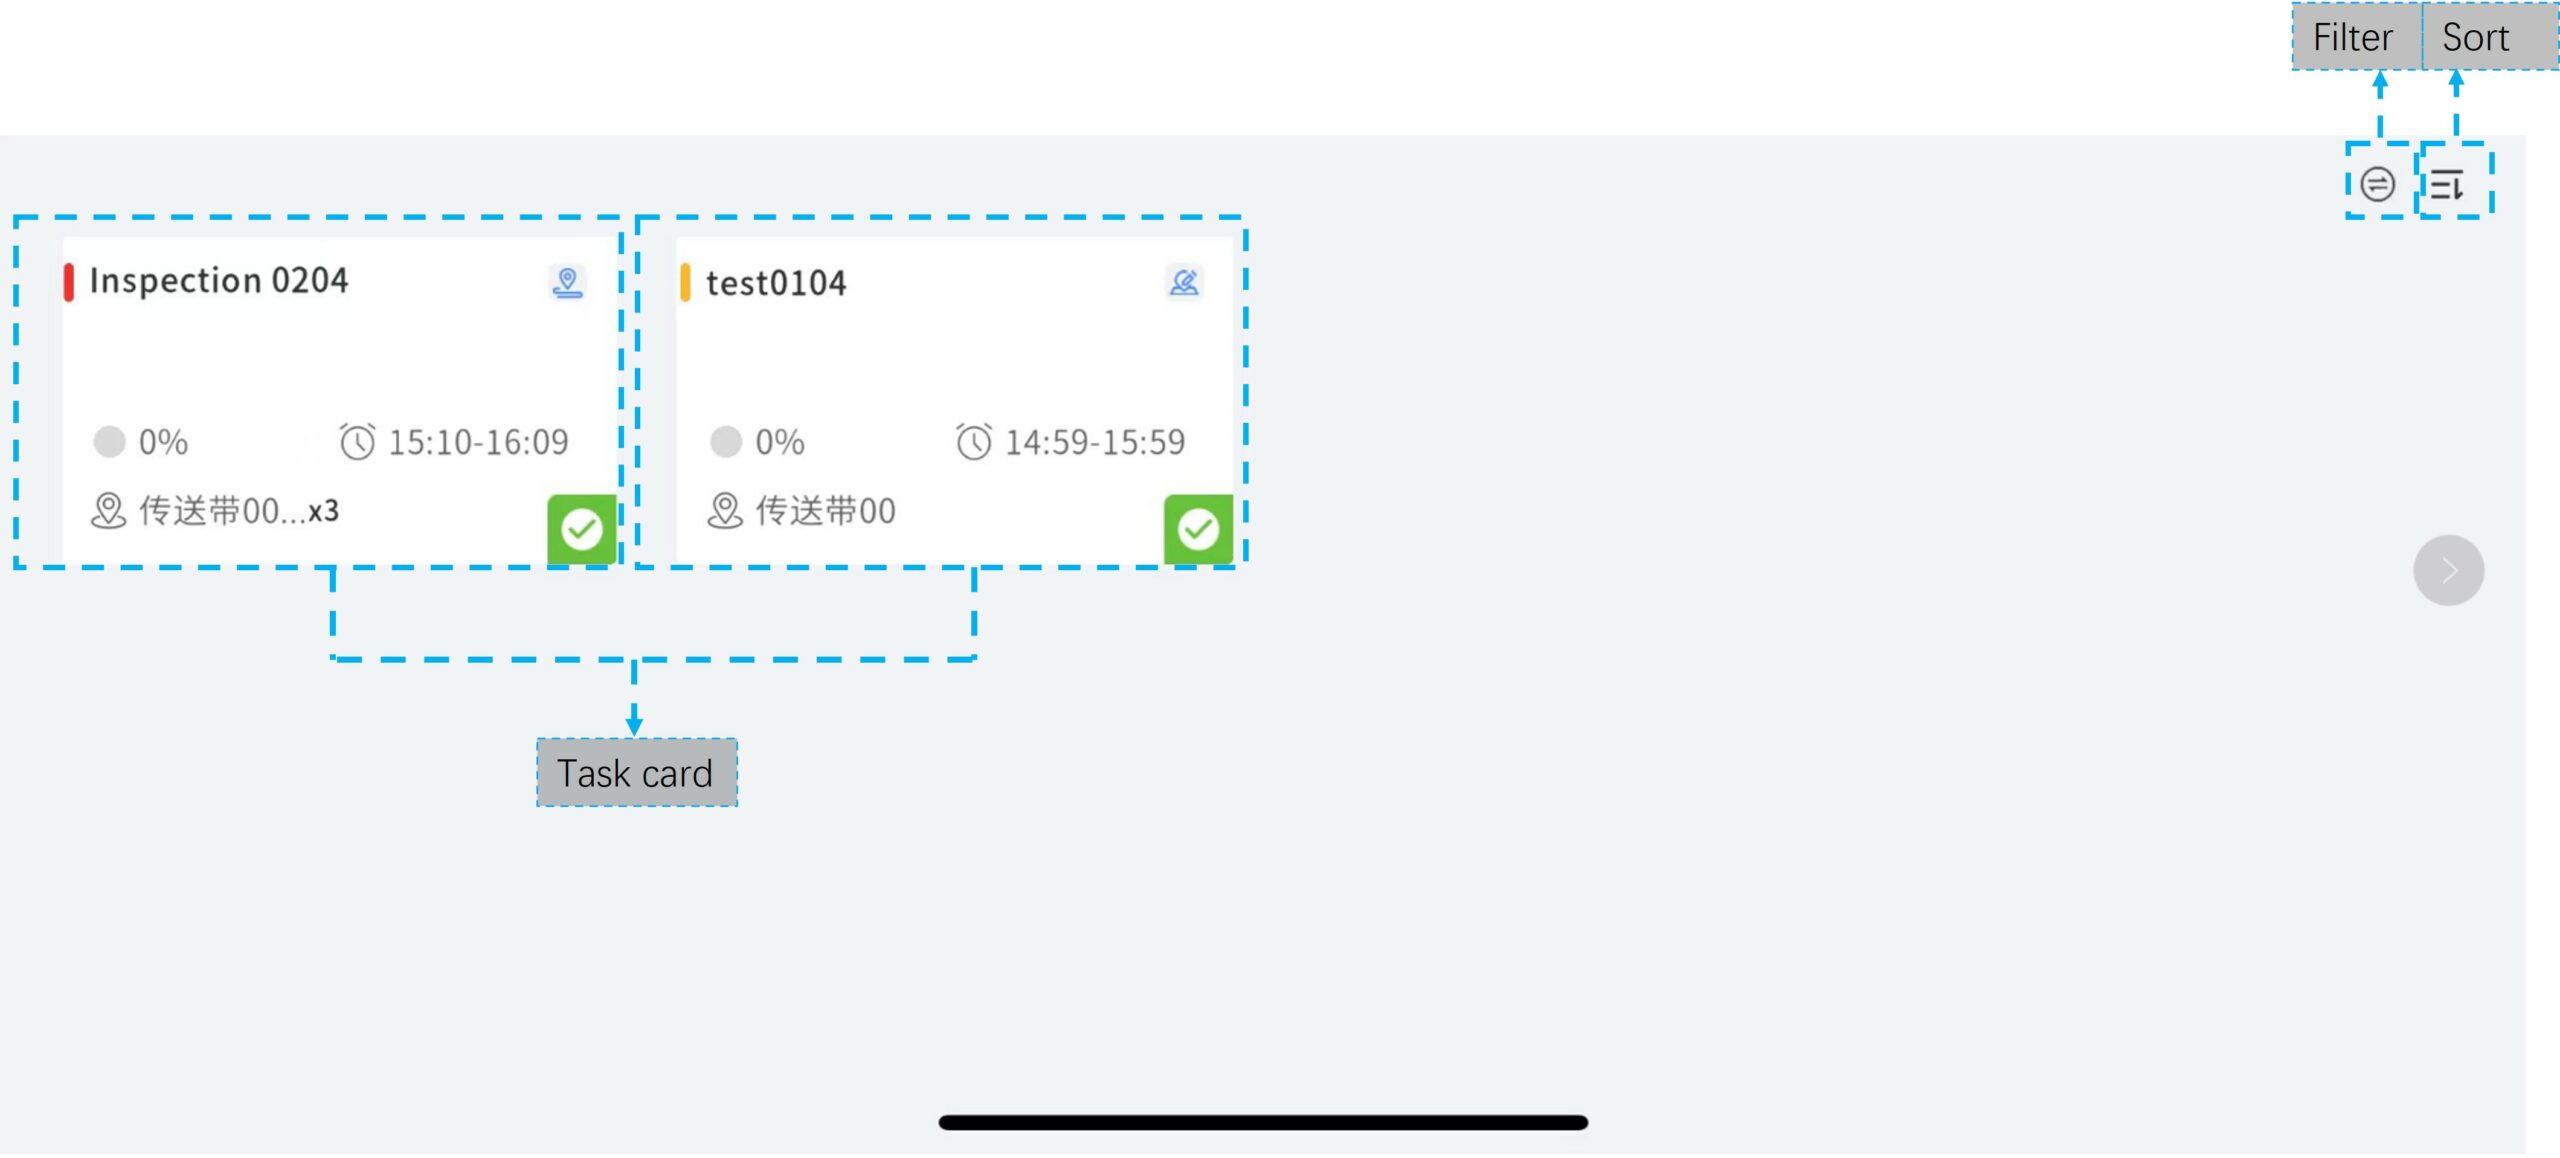
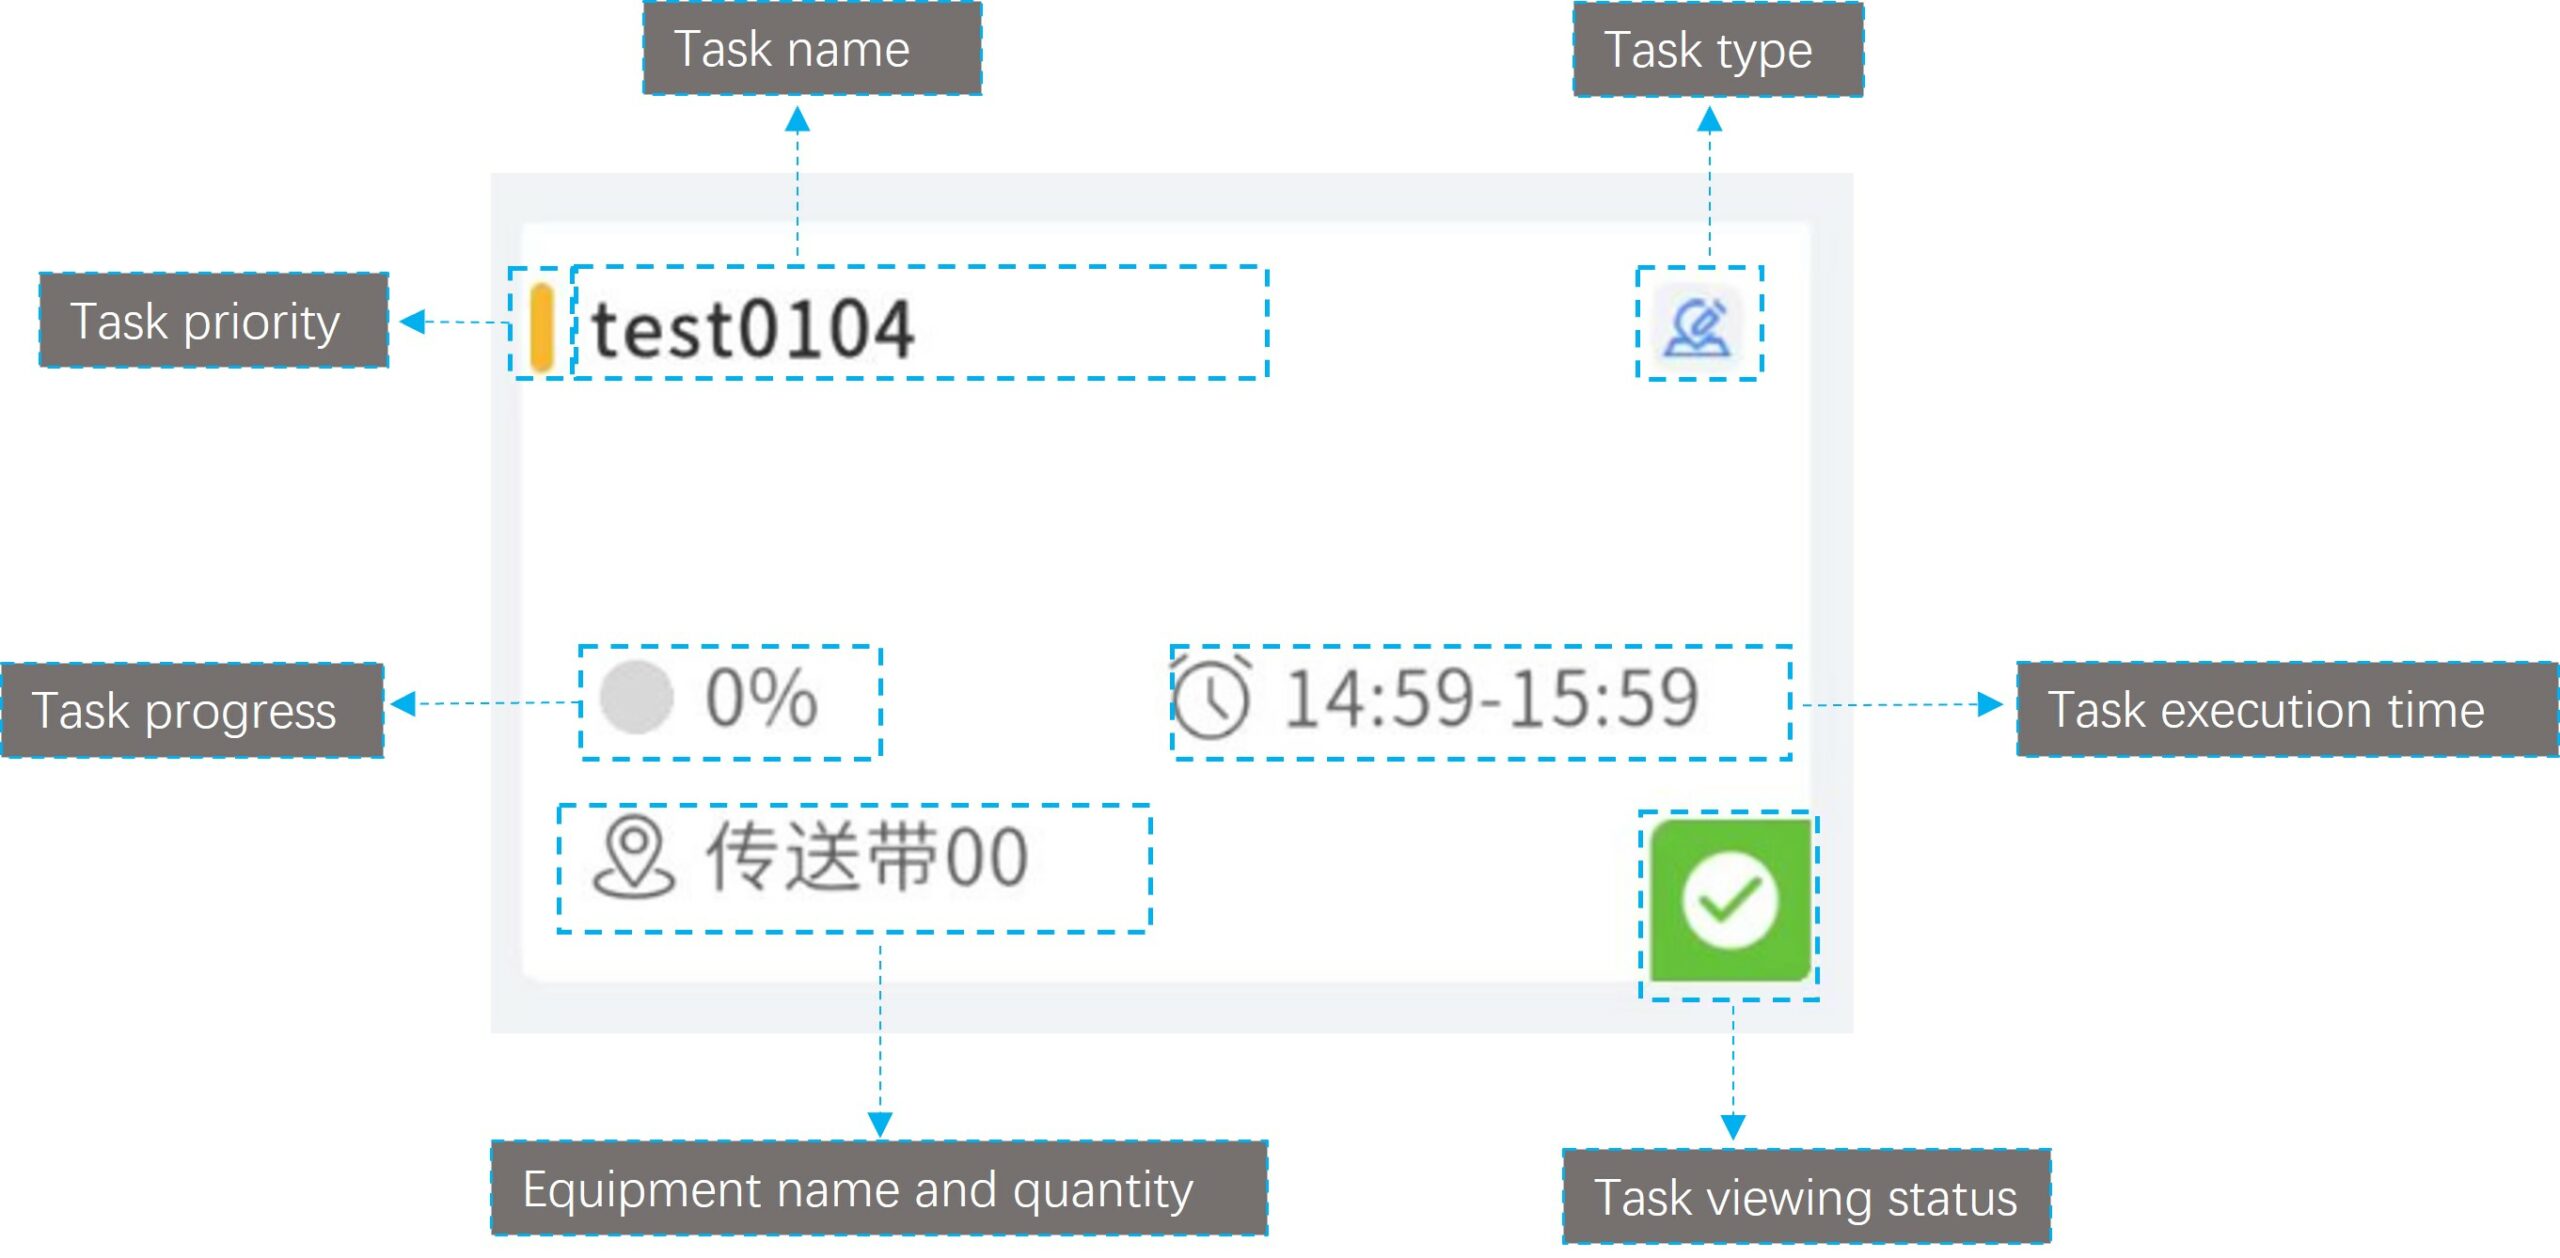
Task card: The task card presents comprehensive task information, including task priority, task name, task type, task progress, task execution time, equipment name and quantity, and task viewing status.
-
- Task priority: Priorities are denoted by colors—red for high priority, yellow for medium, and green for low priority.
- Task type: Different icons represent different task types. Spot tasks are represented by
 , and patrol inspection tasks by
  .
. - Task progress: This displays the percentage of task completion.
- Task execution time: Indicates the period within which the task can be completed.
- Equipment name and quantity: For patrol inspection tasks involving multiple equipment, it shows the equipment names and quantities.
- Task viewing status:
 indicates the task is viewable.
  signifies that resources within the task cannot be viewed, for instance, when the resources have been deleted from the server cloud.
Filter: This feature allows you to filter the task list by spot check or patrol inspection tasks.
Sort: Tasks can be sorted by priority, ascending time order, or descending time order. The default sorting is by task priority. In case of equal priorities, tasks will be sorted in ascending order based on their task start time.
Function menus
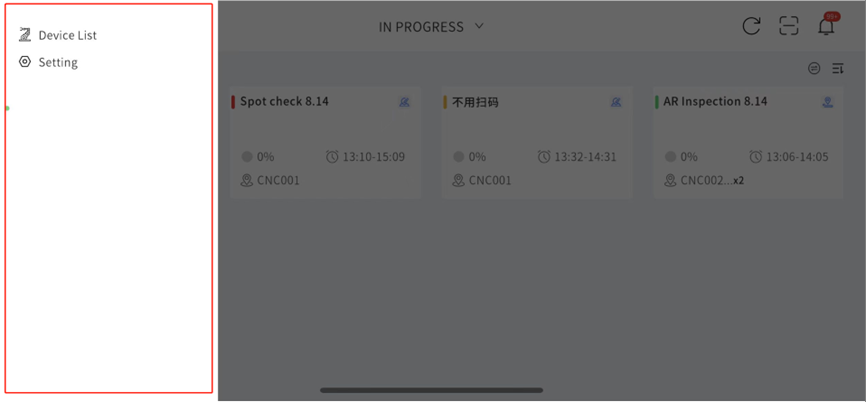
Click the function menu button on the homepage, you will extend the function menus. The function menus consist of two sections: Device List and Setting.
Device List
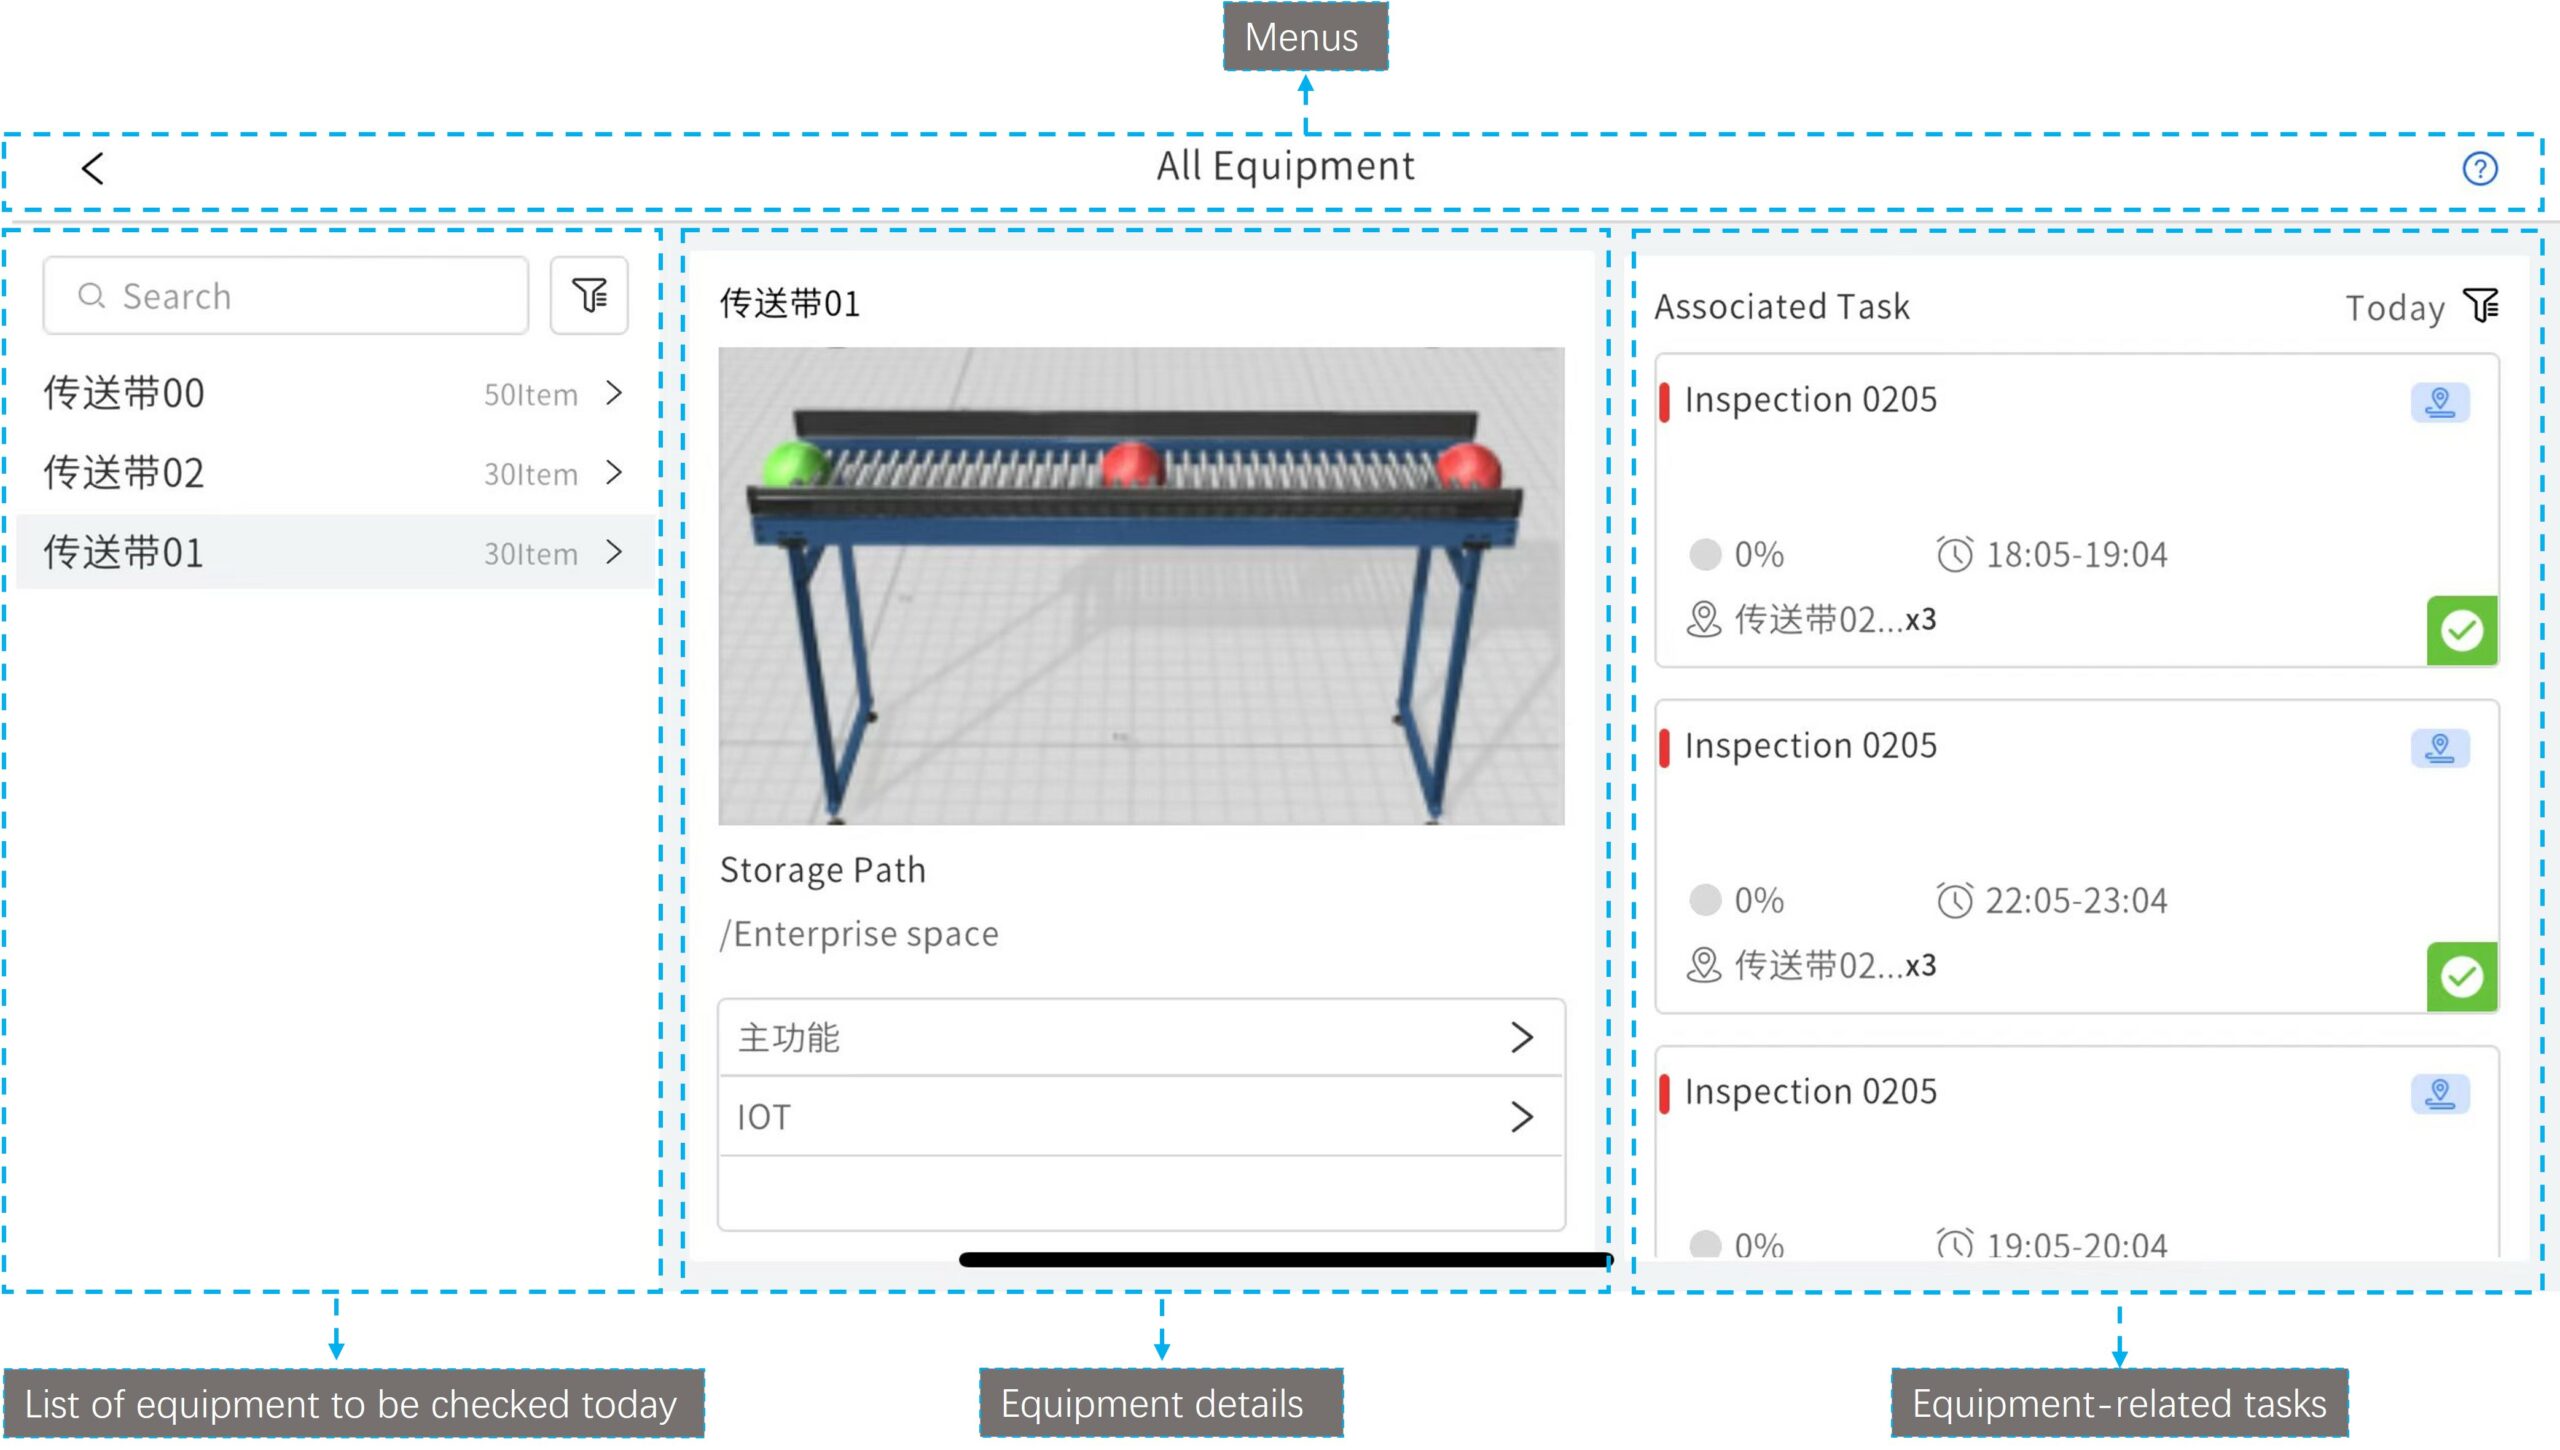
The Device List includes the menus, list of equipment to be checked today, equipment details, and equipment-related task lists.
Menus: It contains the back button, page name, and information indication icon.
List of equipment to be checked today: It displays all equipment that the inspector needs to check on the current day, along with the number of tasks associated with each equipment. You can use the search box to look for specific devices and click the filter button ![]() to filter equipment based on tags.
to filter equipment based on tags.
Equipment details: This section shows the equipment thumbnail, the storage path of the equipment’s digital twin files and the attributes of the digital twin.
Equipment-related tasks: Displays all tasks related to the equipment for today or the past three days.
Settings
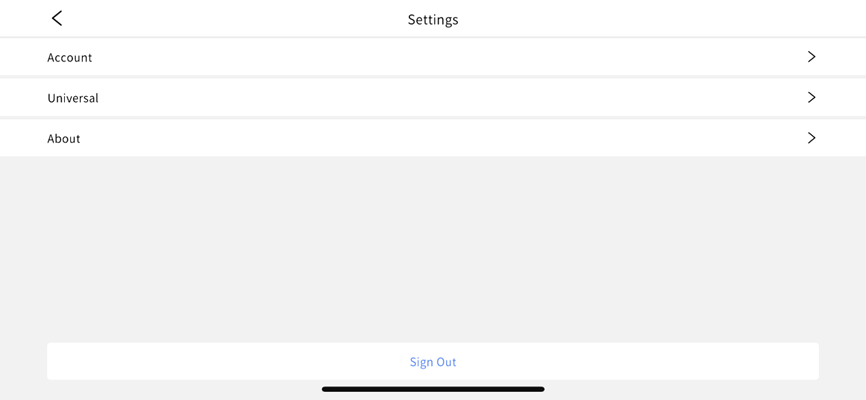
Account: Contains relevant information about the user’s FactVerse account, including username, mail, and enterprise.
Universal: Settings for render, language, location, and cache.
-
- Render: Depending on the hardware capabilities and desired visual quality, you can adjust the rendering level on your own, choosing from 1 to 6 levels.
- Language: The interface language can be switched between Simplified Chinese, English, Japanese, and Traditional Chinese.
- Location: Determines the reference point for positioning during scenario playback, with options for Immediate and Initial. Immediate refers to positioning based on the current playback content, while Initial refers to positioning based on the initial playback content.
- Cache: Click the Clear button
 to clear the cache.
About: You can upload logs and view the current version number of DataMesh Checklist.
Sign out: Click the button to sign out of DataMesh Checklist.
Task operation interface
Click on any task card on the homepage, you can enter the task operation interface. In this interface, you can directly make records and mark equipment status.
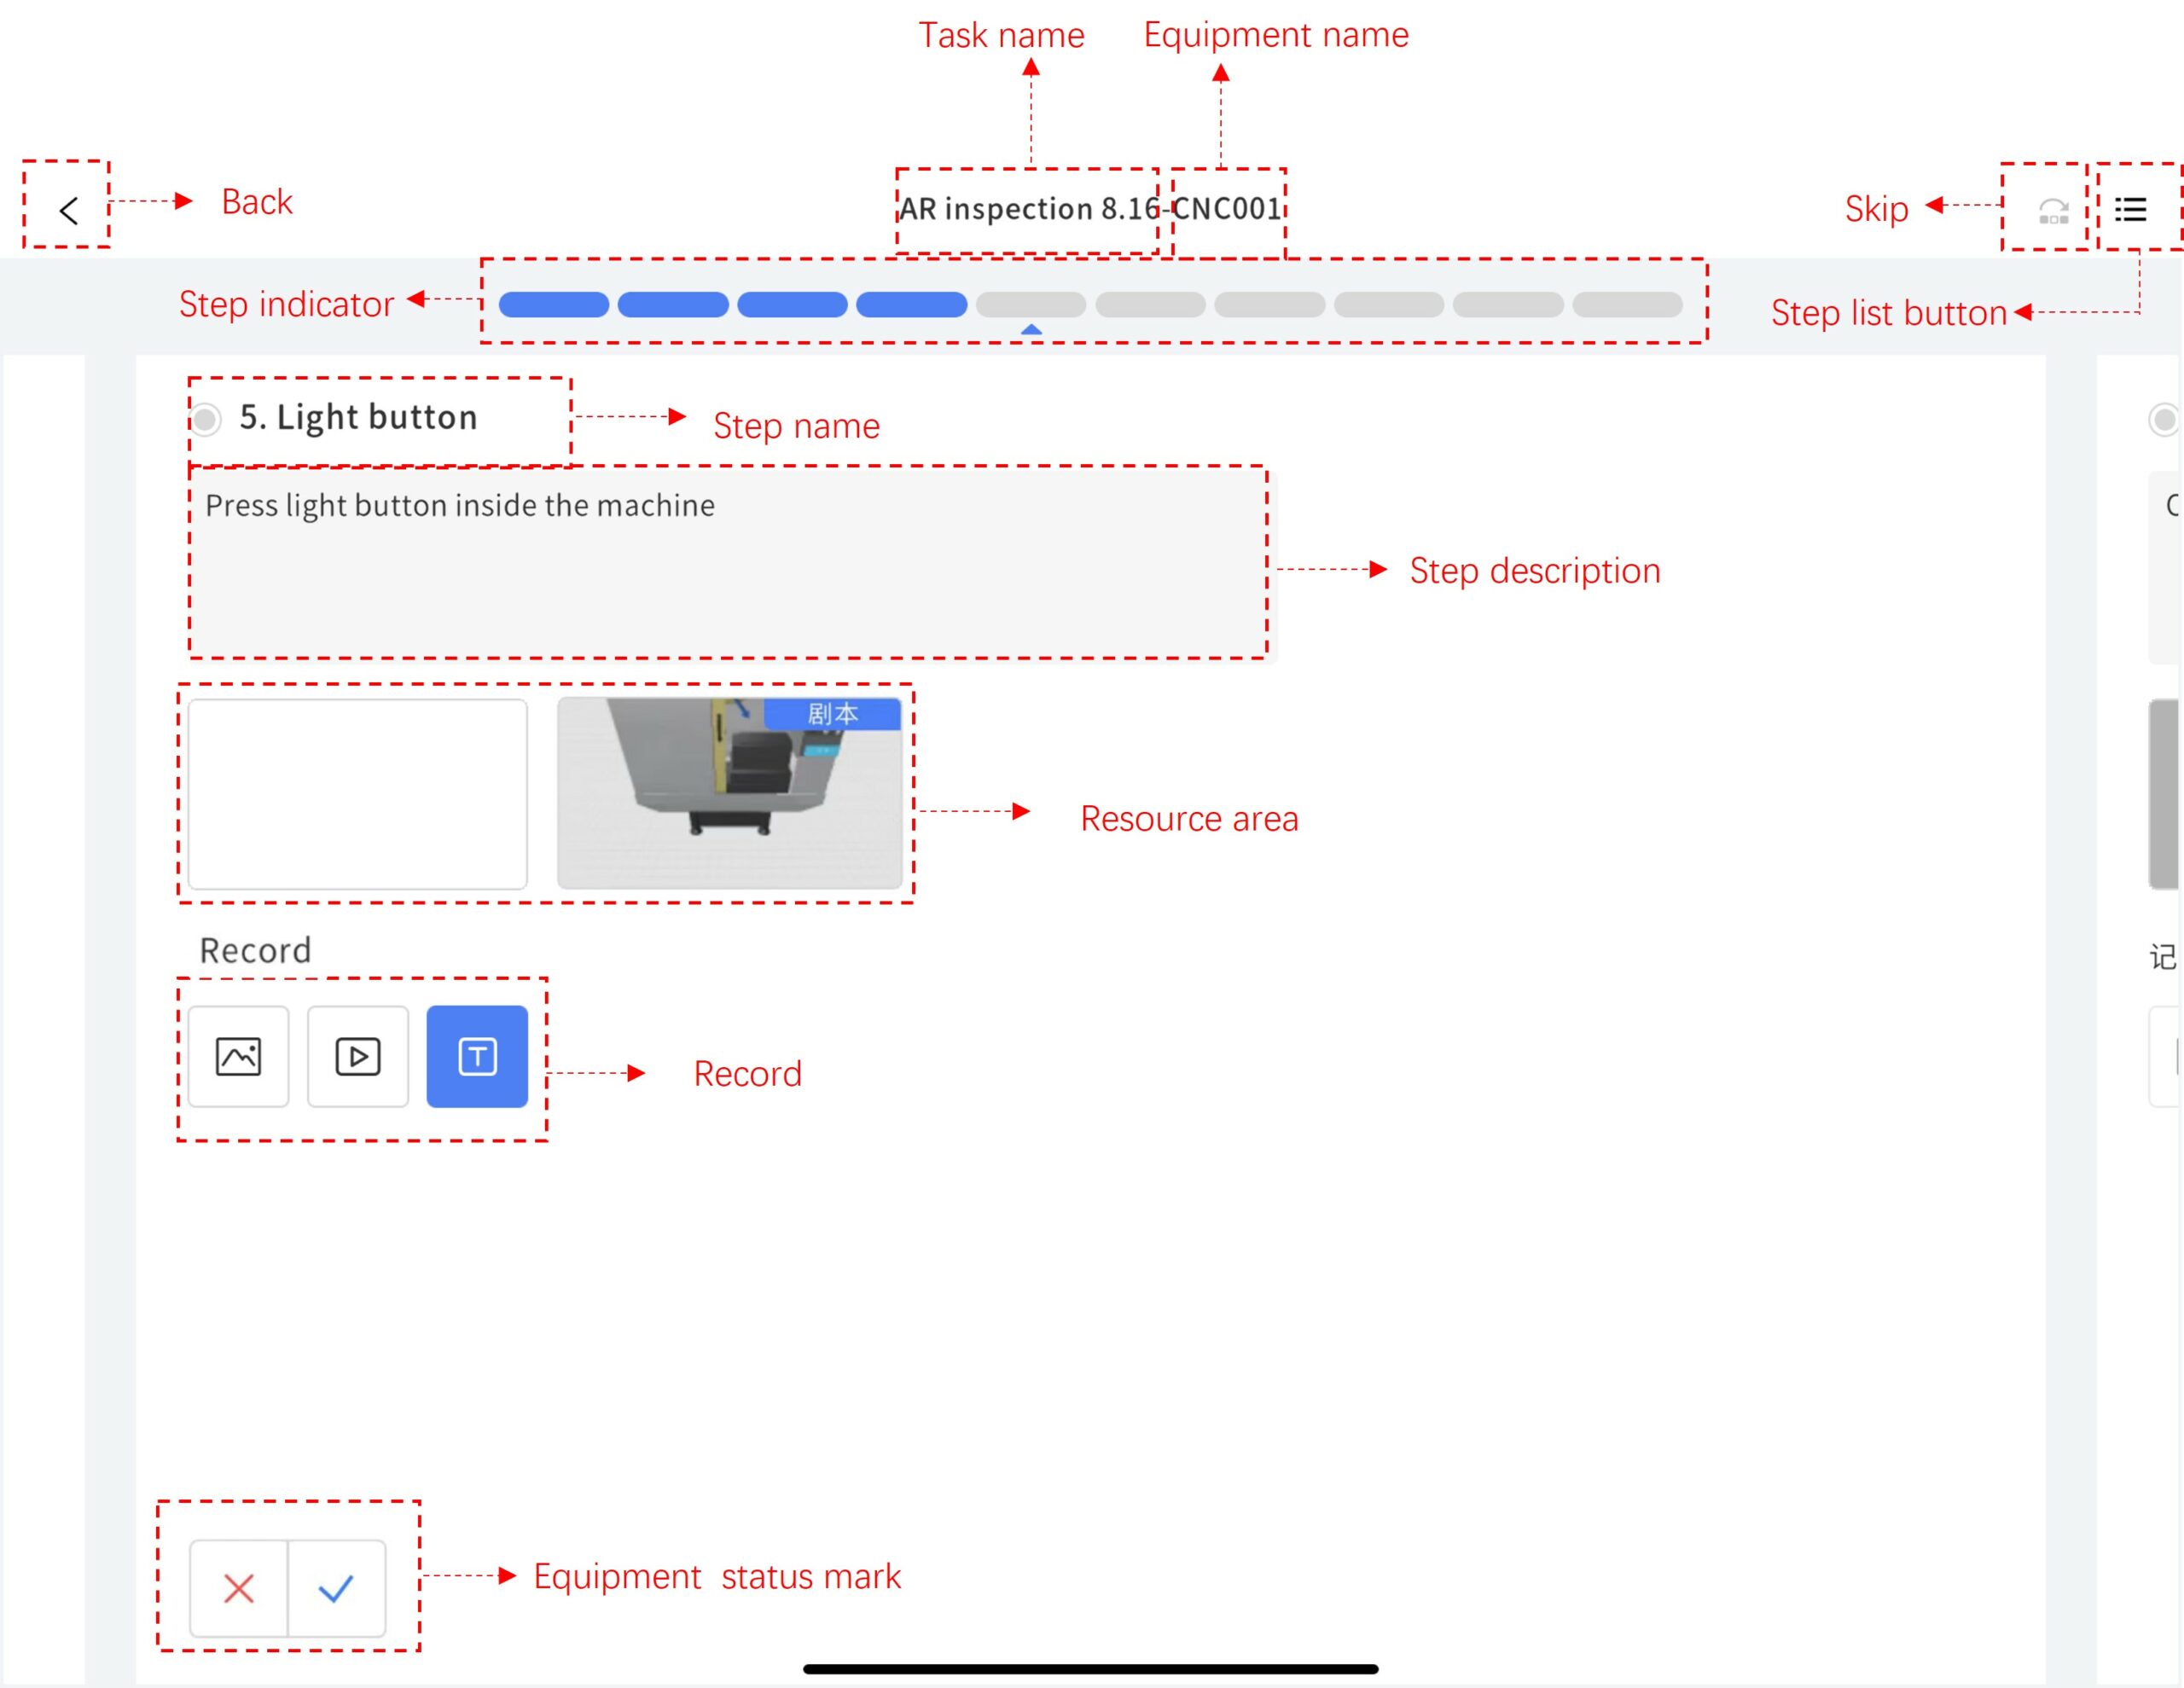
Back button: Clicking the back button, you can return to the homepage.
The main interface’s title is composed of the task name and the device name, connected by a hyphen “-“.
Skip button ![]() : The skip button allows you to bypass inspecting the current device. The system will send a message to the task creator’s account and display a prompt: “Device XX is abnormal – XX task-XX device has been skipped.”
: The skip button allows you to bypass inspecting the current device. The system will send a message to the task creator’s account and display a prompt: “Device XX is abnormal – XX task-XX device has been skipped.”
Step indicator: This shows the current step in the process. Clicking on an individual step tab grants you direct access to that step. A gray step tab indicates a step that has not been executed, blue signifies a completed step with a normal annotation, and red indicates a completed step with an abnormal mark.
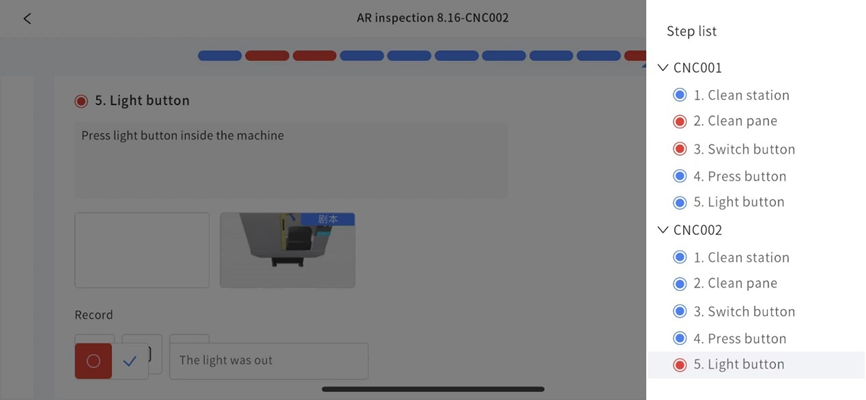
Step list ![]() : This button expands or collapses the step list. If a step has not been executed, the preceding circle remains gray. After completing a step where the equipment is functioning normally, the circle turns blue. For steps completed with a equipment anomaly, the circle becomes red.
: This button expands or collapses the step list. If a step has not been executed, the preceding circle remains gray. After completing a step where the equipment is functioning normally, the circle turns blue. For steps completed with a equipment anomaly, the circle becomes red.
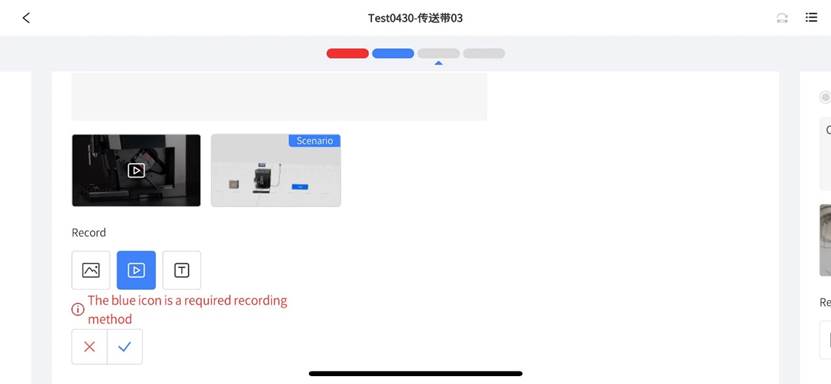
Record: You have the option to record via photo, video, or text. A blue-colored icon denotes a required option.
Equipment status mark: Clicking ![]() indicates an equipment exception and allows you to select an exceptional equipment option. Clicking
indicates an equipment exception and allows you to select an exceptional equipment option. Clicking ![]() signifies a normal equipment and enables you to choose a normal device option. Upon completion, the interface automatically progresses to the next step.
signifies a normal equipment and enables you to choose a normal device option. Upon completion, the interface automatically progresses to the next step.
Note: When the following conditions coexist, it is required to make records to complete the step properly:
-
- The device is abnormal, and the inspector marked it as such.
- The step was designated as a required recording item when the task was created.
Scenario operation interface
If the task is associated with a scenario, you can access the scenario operation interface by clicking on the scenario file in the resource section of the task operation interface. Users have the option to choose between 3D mode and MR mode when entering the scenario operation interface, with 3D being the default mode.
3D mode
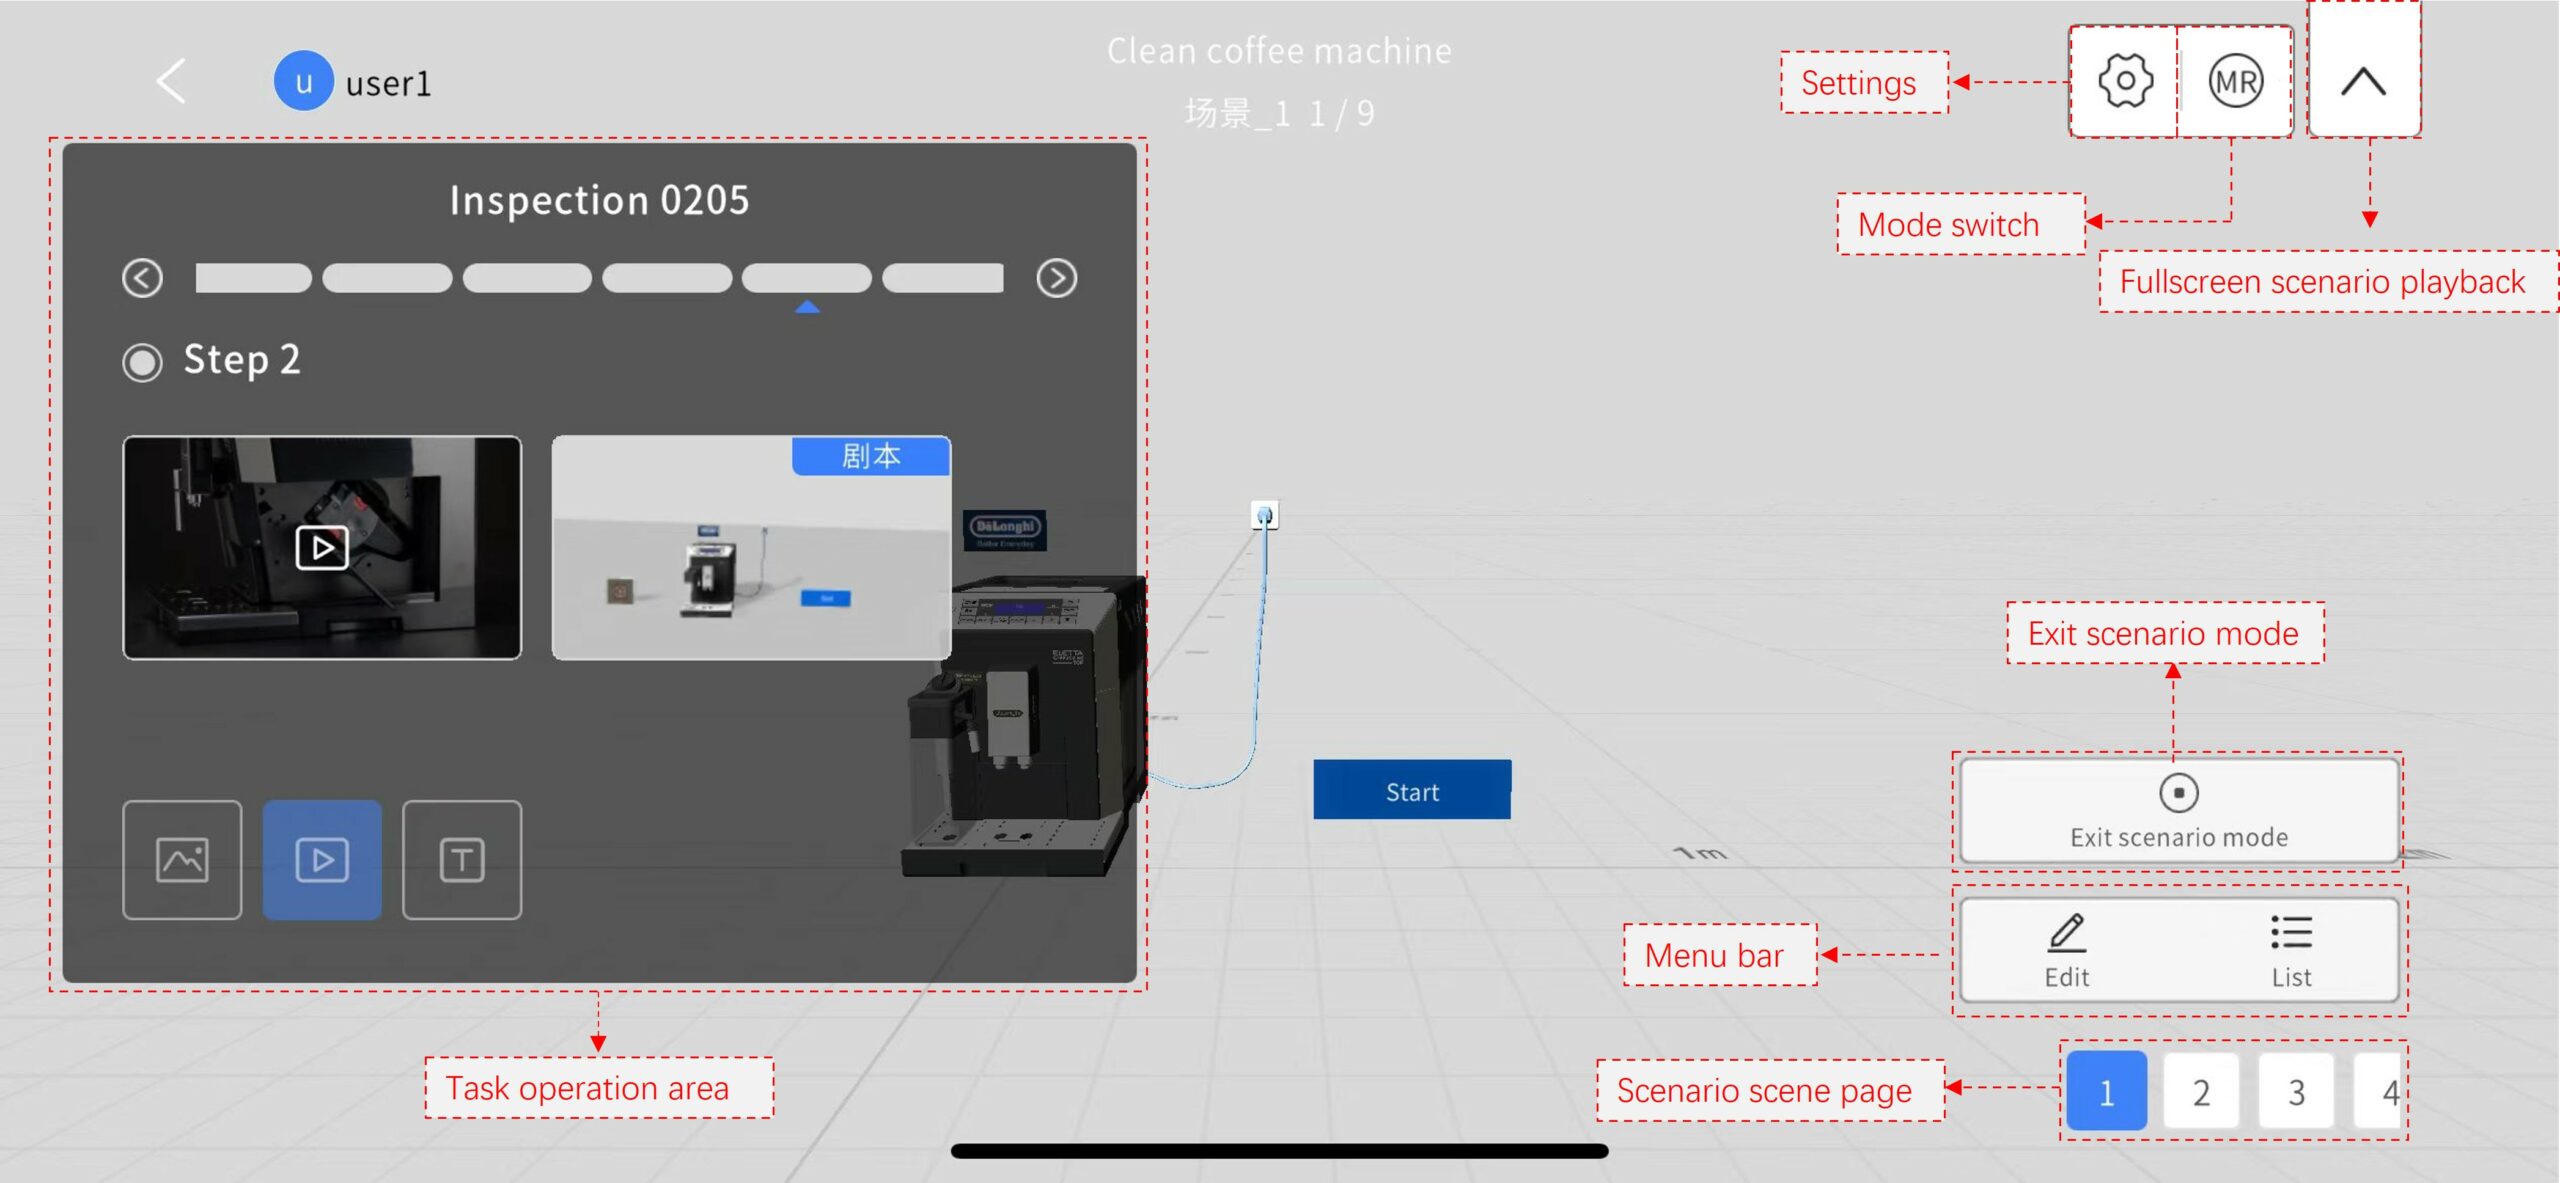
Task operation area: In the scenario operation interface, the task operation area is a minimized pane of the task operation interface, making it convenient for users to record and mark the status of tasks while watching the scenario. For more information about the task operation area, please refer to the instructions in the Task operation interface.
Settings:
- Universal: Depending on the hardware capabilities and desired visual quality, you can adjust the rendering level on your own, choosing from 1 to 6 levels. You can also switch the interface language between Simplified Chinese, English, Japanese, and Traditional Chinese.
- About: You can upload logs and view the current software version.
Mode switch: Click this button ![]() to play scenario in MR mode or 3D mode.
to play scenario in MR mode or 3D mode.
Fullscreen scenario playback: By clicking the ![]() button, you can initiate full-screen scenario playback. Clicking
button, you can initiate full-screen scenario playback. Clicking ![]() will bring you back to the scenario operation interface.
will bring you back to the scenario operation interface.
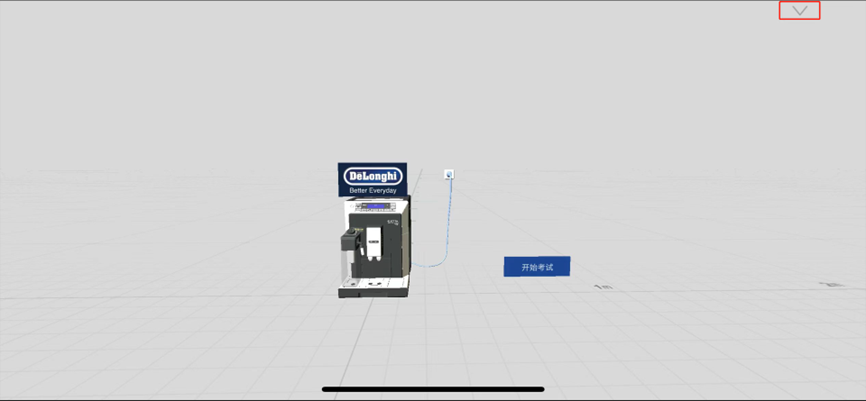
Exit scenario mode: Click the button to exit scenario mode and return to Task operation interface.
Menu Bar:
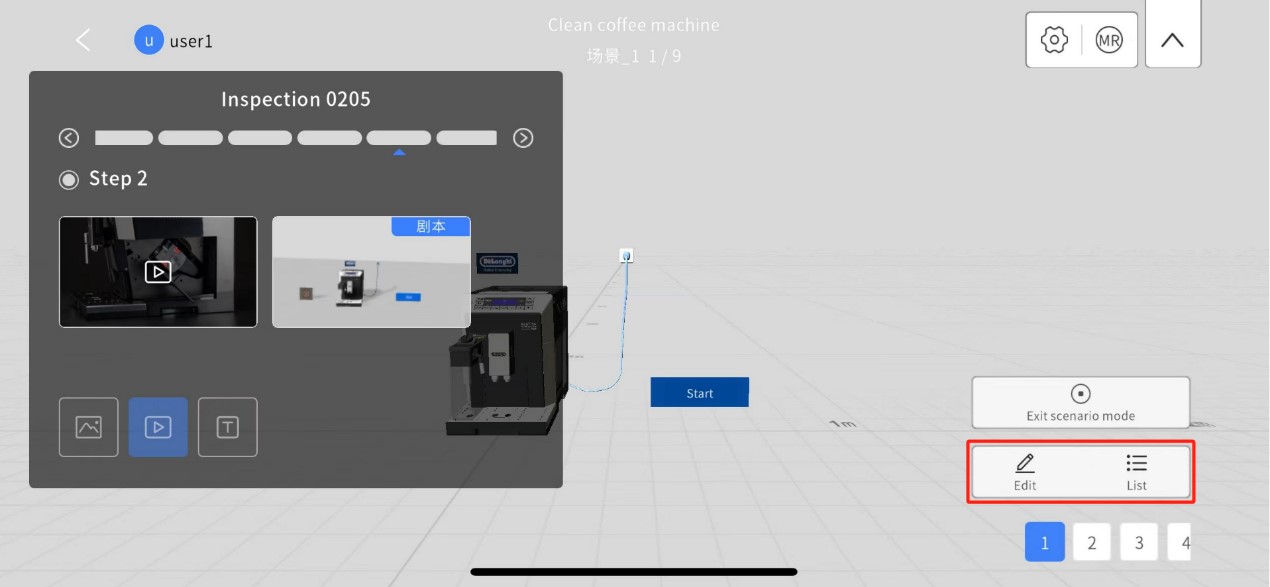
-
- Edit: Click the Edit button, you can enter the scenario editing interface. In the scenario editing interface, you can:
a). Adjust the scene: Click on a blank area of the scene and drag it to adjust its position. Using gestures, pinch or spread two fingers on the screen to zoom in or out on the scene. Alternatively, you can use the zoom in/out buttons on the right to adjust the scene’s scale.
b). Adjust the model: Click on a model or sub-model and drag it to reposition it. You can use gestures to zoom in or out on the model or use the zoom in/out buttons on the right to adjust its scale.
c). View properties: After selecting a model, clicking the ![]() button allows you to view its properties.
button allows you to view its properties.
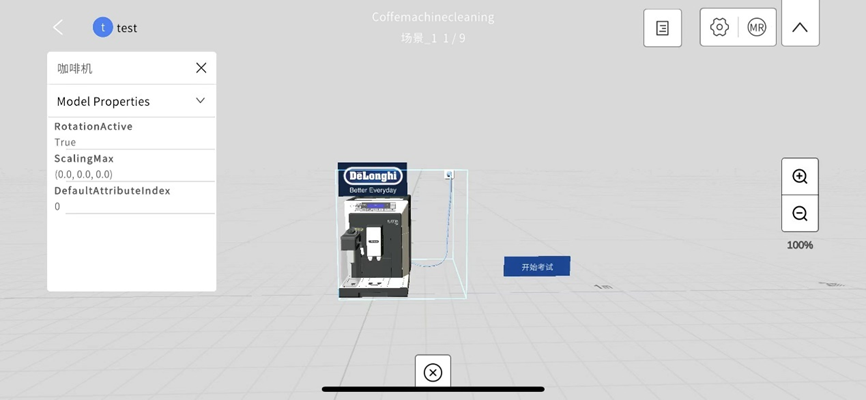
d). Exit: Clicking the ![]() button exits the scenario editing interface.
button exits the scenario editing interface.
-
- List: Click the List button to expand the scenario scene list.
- Stop: Click the Stop button to exit the scenario operation interface and return to the task operation interface.
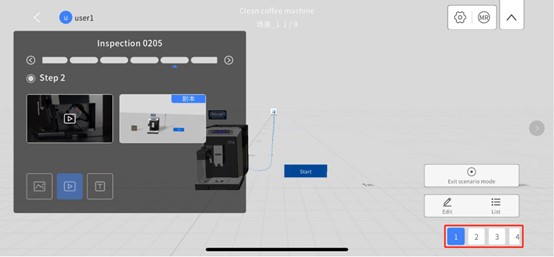
Scenario scene pages: This area displays the range of scenario scene pages accessible in the current task step. You can click on a scene page number or swipe to switch between scenario scenes.
MR mode
Clicking the MR button ![]() on the scenario operation interface switches to MR mode. In MR mode, the main interface of the scenario operation is as follows:
on the scenario operation interface switches to MR mode. In MR mode, the main interface of the scenario operation is as follows:
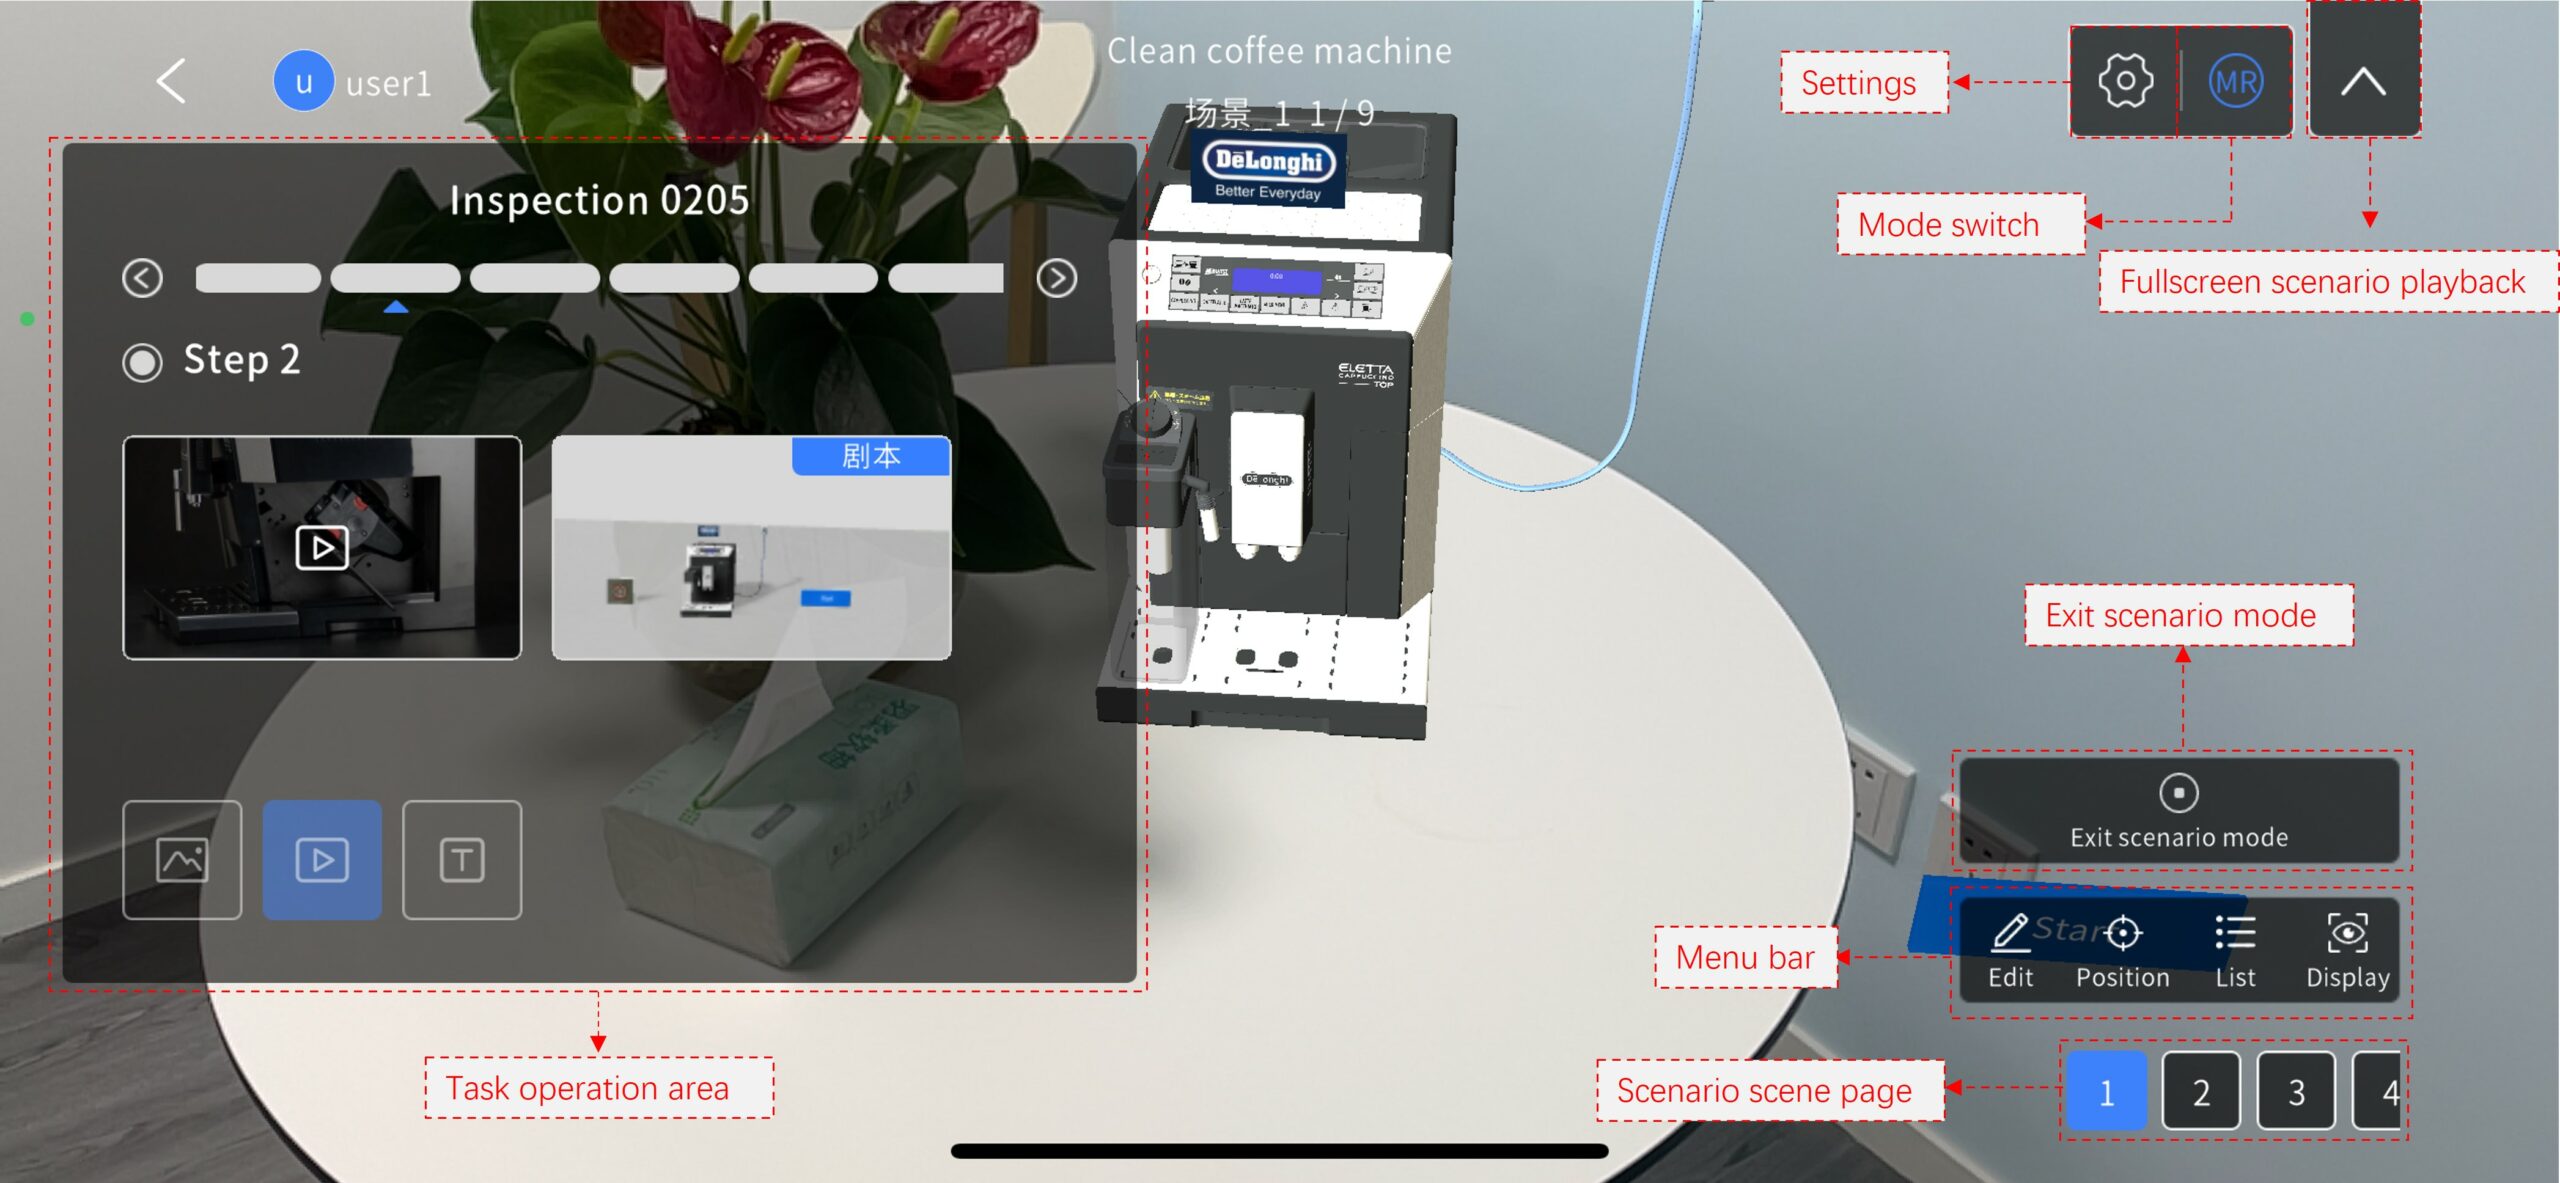
Task operation area: Same as the 3D mode.
Settings: Same as the 3D mode.
Mode switch: Same as the 3D mode.
Fullscreen scenario playback: Same as the 3D mode.
Exit scenario mode: Same as the 3D mode.
Menu bar: The menu bar includes Edit, Position, List, Display, and Stop.
-
- Edit
 : Same as the 3D mode.
 - Position
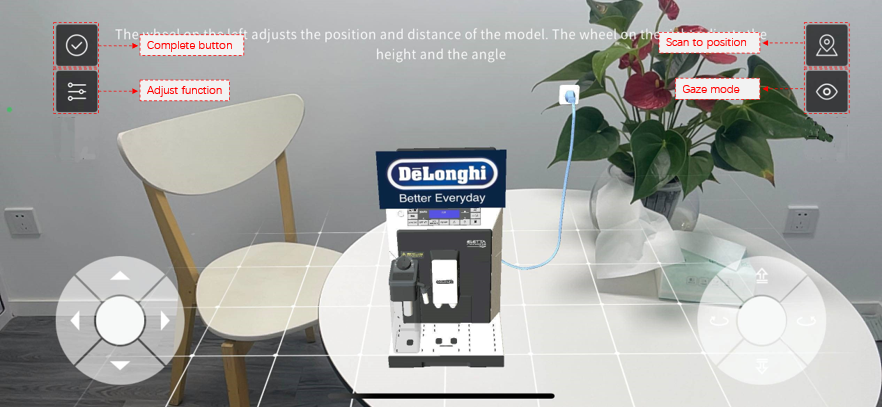
 : Clicking the Position button enters the position mode. When switching to MR scenario mode, it defaults to entering the position mode first. Position mode is a mode within the MR scene for precise positioning of resources. It enables adjustments to the resource’s position, distance, height, and angle, ensuring that the resource is placed precisely where needed. Click the Position button to enter the position mode. Position mode is a mode for precise positioning of resources in the MR scene. It allows you to adjust the position, distance, height, and angle of resources to ensure they are placed where needed. When switching to MR scenario playback mode, it defaults to entering position mode. For more detailed information about position mode, please refer to DataMesh One User Manual.
- Edit
-
- List
 : Click the List button to expand the scenario scene list.
 - Display
 : Click Display to change the transparency of model.
 - Stop
 : Clicking Stop exits the scenario operation interface and returns to the task operation interface.
- List
Scenario scene pages: Same as the 3D mode.