How Can We Help?
Data Fusion Services (DFS) Overview
Introduction
Data Fusion Services (DFS) is an integrated data service within the DataMesh FactVerse platform.
It enables organizations to seamlessly connect structured and unstructured data from enterprise systems to digital twin models—establishing a truly data-driven virtual environment.
With DFS, users can stream real-time field data into the platform, process it through configurable workflows, and distribute the results to XR clients, visualization dashboards, or AI inference engines.
This creates a closed data loop linking business systems, digital models, and interactive applications.
Key benefits of DFS
- Connect physical and digital worlds: Map live data from equipment, production lines, or environments into FactVerse digital twins.
- Turn data into reusable assets: Convert analytics workflows and domain expertise into shareable, repeatable intelligence modules.
- Accelerate data-driven decisions: Visualize and analyze data outputs to enable intelligent monitoring and cross-platform collaboration.

DFS operates through three fundamental stages:
Stage | Description |
Data Ingestion & Storage | Integrates data from enterprise systems and acquisition platforms, importing structured information into DFS for unified management and backup. |
Data Processing & Transformation | Cleanses, converts, and analyzes data according to predefined or custom logic, preparing it for modeling and visualization. |
Data Organization & Delivery | Structures processed data into dashboards, charts, or XR-ready formats, and outputs them to FactVerse for interactive digital-twin visualization. |
Key Concepts
Data Exploration
Data exploration in DFS is a process that transforms raw data into meaningful insights through visualization, statistical analysis, and intelligent computation. It focuses on identifying anomalies, understanding data distribution, and supporting business monitoring and decision-making.
A typical exploration process involves three major stages: data preprocessing, feature extraction, and anomaly detection or alert configuration.
Data Preprocessing
Preprocessing prepares data for subsequent analysis by cleaning, transforming, and organizing it according to the characteristics of each dataset or task.
This ensures data consistency, accuracy, and readiness for downstream analysis and visualization.
Feature Extraction
Feature extraction identifies key statistical or behavioral characteristics from raw data that are critical to the specific business scenario.
For example, in equipment monitoring, features might include average operating temperature, vibration amplitude, or cycle duration. These extracted indicators are later used for modeling, comparison, or alert generation.
Nodes
To simplify the configuration of data exploration tasks, DFS abstracts each data-processing step into modular components called nodes.
Each node represents a discrete operation—such as preprocessing, feature extraction, or computation—and can be connected with other nodes to form an executable data-flow pipeline.
Nodes allow visual task design and make the exploration logic transparent and reusable.
Sliding Window
A sliding window is a data-processing technique that divides continuous data streams into overlapping segments for localized computation.
Instead of processing the entire dataset at once, DFS analyzes smaller sections within the defined window, enabling more granular time-series analysis.
Sliding windows are commonly used to calculate local metrics such as averages, maximums, minimums, or standard deviations over time.
Window Size
The window size defines the range of data processed at one time.
For example, a window size of 10 indicates that each calculation uses 10 consecutive data points.
Larger window sizes capture broader trends, while smaller ones provide higher temporal resolution.
Step Size (Sliding Interval)
Step size determines how far the window moves during each iteration.
It specifies the number of data points the window advances after each calculation, controlling both the computation frequency and the smoothness of results.
A smaller step size increases precision but also computation cost; a larger step size produces faster but coarser analyses.
Alert Rules: Define rule-based indicators for the extracted feature values according to different requirements. When the data exceeds the specified thresholds or criteria, an alert is triggered.
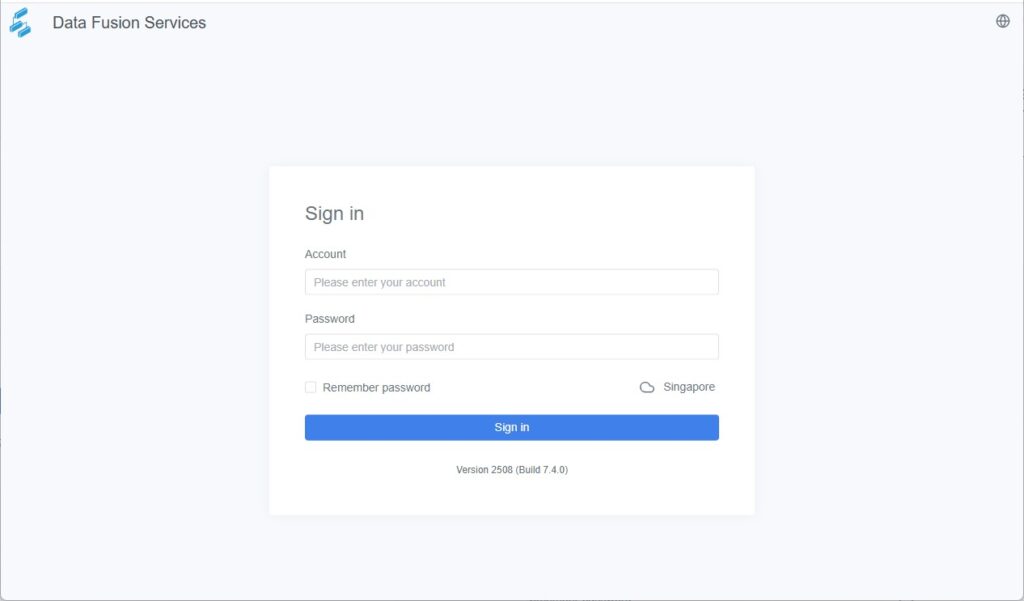
Login
- Open a web browser, enter the system URL, and navigate to the login page.

- Click the Language icon
 to switch the interface language.
DFS supports four interface languages: Simplified Chinese, English, Japanese, and Traditional Chinese.
- Click the Server icon
 to switch to a different server.
 - Enter your account and password (please contact your enterprise administrator if you do not have login credentials).
- Click Sign In to access the system.