How Can We Help?
Function Description
Simulation Task Management
The Simulation Task Management module is used to manage and configure simulation tasks that run on historical or simulated data.
Creating a Historical Data Source Simulation Task
A historical data source simulation task can be used for data playback, simulation testing, and trend analysis. It helps users simulate scenarios based on historical data collected from devices or environments.
Preparing Historical Data
Definition
Historical data refers to time-series data continuously recorded from a digital twin scene or physical equipment during operation. DFS automatically stores and accumulates this data to provide reliable input for simulation tasks.
Data Sources
Type | Source | Typical Use | Example |
Scene Historical Data | Automatically generated during scene operation or playback | Scene playback, multi-device interaction analysis | Production line scenario: coordinated operation of a robotic arm, conveyor belt, and inspection station |
Device Historical Data |
| Single device status verification, algorithm testing, feature extraction | CNC machine A: spindle speed and temperature record |
Notes
- Using Scene Historical Data: Complete the following steps in DFS before use:
- Set up device information. (See Binding Devices and Digital Twins.)
- Import the scene.
- Bind digital twins in the scene to corresponding devices.
- Using Device Historical Data: Choose one of the following methods (refer to Binding Devices and Digital Twins for details):
- Import via the device binding page
- Connect during adapter instance creation
- Upload when creating a simulation task
Creating a Simulation Task
Prerequisites
Ensure that the selected device or scene already has historical data; otherwise, the simulation task cannot be executed.
1. Create a new task:
Navigate to Simulation Task Management > Historical Data Source Simulation and click [New Task] to open the creation window.
2. Name the task:
Enter a name for the simulation task.
3. Select data source (device or scene):
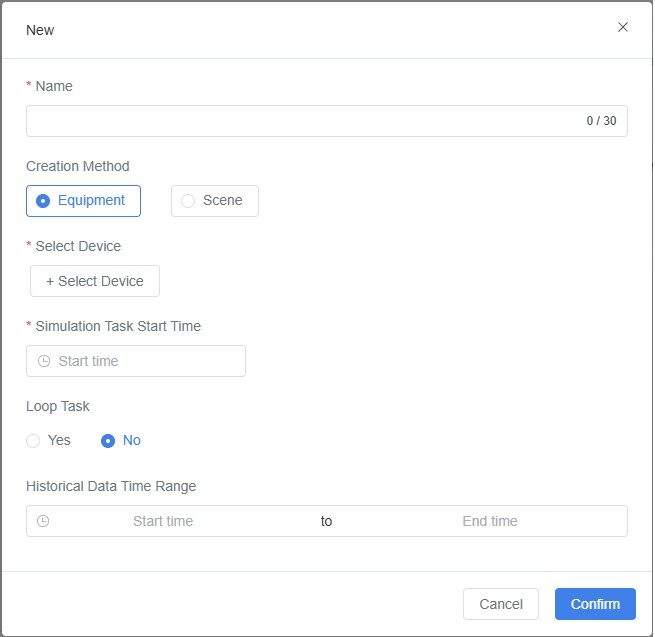
- Device Historical Data:
Select Device, then click [+ Select Device] and choose one or more devices from the list. - Scene Historical Data:
Select Scene, then click [+ Select Scene] and choose a scene from the list.
4. Set the simulation start time:
Define when the simulation task should begin execution.
5. Enable or disable loop simulation:
- Enabled: The task will run continuously, suitable for long-term testing or display scenarios.
- Disabled: The task runs once only, suitable for single test or verification purposes.
6. (Optional) Select historical data range:
Choose the playback time range for the historical data.
7. Confirm creation:
Click [Confirm] to complete the creation of the simulation task.
Result
- A new simulation task based on historical data will be created.
- The task can be viewed and played back in the task list.
- It can drive digital twins or scenes to reproduce historical device behavior for validation, demonstration, or analysis.
Creating a Simulated Data Source Simulation Task
The simulated data source is used to generate data streams when no real device data is available, supporting testing, validation, or demonstrations.
When real devices or live data are unavailable, you can upload simulated data files to create an initial dataset for virtual devices. During task execution, DFS stores this data as historical device data.
Use Cases
- Device Testing: Simulate device data under specific conditions to verify response or optimize configuration.
- Data Display or Validation: Demonstrate or validate scenarios when historical or real-time data is unavailable.
- Early Development Stage: Use simulated data for testing and demonstration before devices produce live data.
Preparing the Data File
Supported Formats: XLS / XLSX / TXT / JSON
How to Obtain Simulated Data Files
- Use System Templates (Recommended)
- In Simulation Task Management > Simulation Data Source, click [New Task] > Excel or Text Template to download predefined templates.
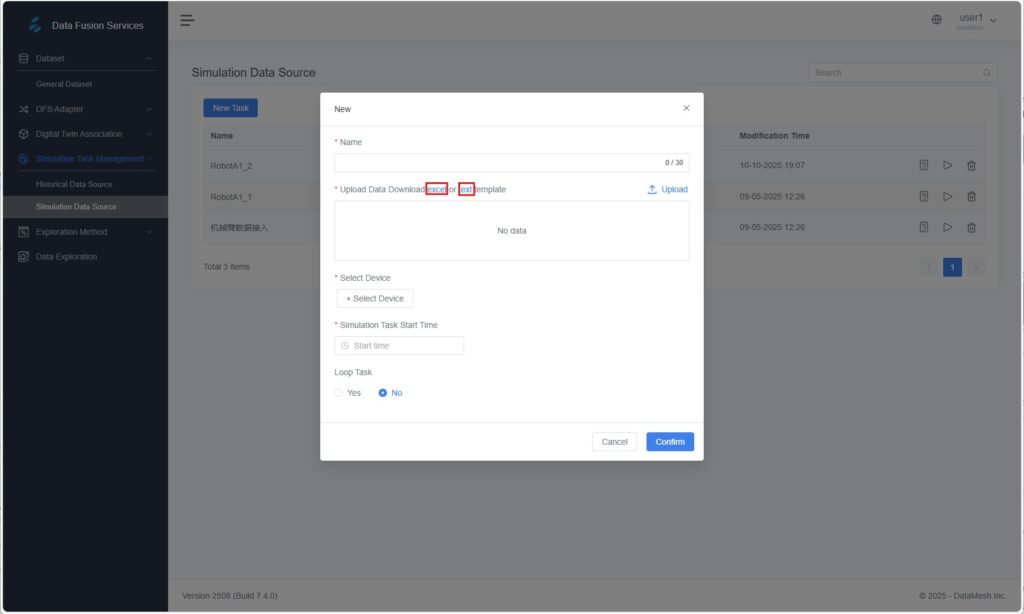
- Fill in the device name, attributes, and data values according to the template, then upload the file.
- Export from Existing Device Systems
- If your existing system (e.g., PLC, MES, or sensor platform) supports data export, you can directly export data.
- Adjust the exported file to match the DFS template format, ensuring consistent field names, timestamps, and attributes.
- Manually Created or Script-Generated Data
- When no real device data is available, manually fill in key attributes in the template.
- Alternatively, use external tools or scripts to generate test data and convert it to the DFS template format.
Excel Template Example
Device Name (name) | Device Attribute (key) | Device Attribute Value (value) | Data Generation Timestamp (optional) |
TestDevice | temperature | 123 | 1709797575817 |
Field Descriptions
- Device Name (name): Unique identifier of the device, e.g., TestDevice.
- Device Attribute (key): Attribute name, e.g., temperature, speed, pressure.
- Device Attribute Value (value): Numeric value of the attribute, e.g., 123.
- Data Generation Timestamp: Millisecond-level timestamp. If left empty, the system automatically fills it with the upload time.
Text / JSON Template Example
[ { “serial”: “Device name”, “ts”: “String or integer millisecond timestamp”, “datas”: { “key1”: “data1”, “key2”: “data2” } } ] |
Parameter Descriptions
- serial: Device name.
- ts: Millisecond timestamp.
- datas: Device attributes and their values.
- key: Attribute name
- data: Attribute value
⚠️ Note: The device attribute names must match those of the digital twin.
If they differ, manual mapping is required in the Device and Digital Twin Binding step.
Creating a Simulation Task
1. Create a new simulation task:
In Simulation Task Management > Simulation Data Source, click [New Task] to open the creation window.
2. Enter simulation task information:
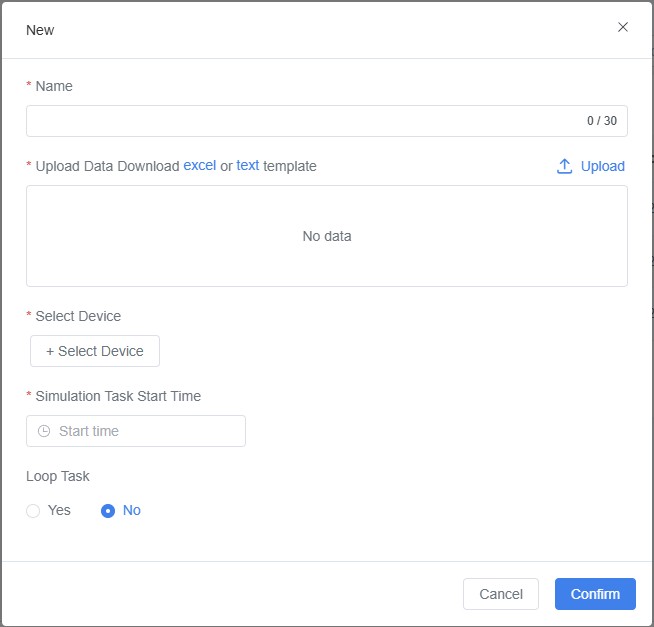
a) Name the task: Enter a name for the simulation task.
b) Upload data: Import the device data file to generate device information.
- Upload an existing data file; or
- Download a system template, fill it out, and upload it (see Preparing the Data File).
c) Select devices: Click [+ Select Device] and choose the devices to be used for the simulation task.
Note: Only devices included in the uploaded data file can participate in the simulation task.
d) Set simulation start time: Define when the task should start running.
e) Enable or disable loop simulation:
- Enabled: The task will run continuously, suitable for long-term testing or display.
- Disabled: The task runs once only, suitable for single verification scenarios.
3. Confirm task creation:
Click [Confirm] to complete the creation of the simulation task.
Result
- A new simulation task based on simulated data is created.
- The generated simulated data source can be replayed to drive digital twins, support scene display, or perform validation.
DFS Adapter
The DFS Adapter serves as a bridge between external data sources and the DFS platform. It is primarily used to receive, preprocess, and transform real-time data streams, ensuring that data can be accurately parsed, stored, and applied within the DFS system.
Through the DFS Adapter, you can connect real-time data from devices, control systems, or business platforms to the FactVerse platform, enabling real-time, data-driven twin behavior and business interaction.
Core Functions
- Data Access: Connect to various industrial data sources (e.g., PLCs, IoT platforms, gateways).
- Data Preprocessing: Clean, transform, and standardize data structures.
- Data-Driven Digital Twins: Bind data to twin attributes to reflect real-time operational status.
- Flexible Configuration: Supports graphical workflow configuration through Node-RED to enhance transparency and efficiency in data processing.
Key Concepts
Term | Description |
Adapter Template | A predefined Node-RED flow template that includes data collection, processing, and cleaning rules for rapid reuse and standardization. |
Adapter Instance | A specific data access point created from a template. Each instance corresponds to an actual data access task with independent configuration parameters such as address, port, and authentication key. |
Real-Time Data Source | Devices or platforms that output live data, such as PLC controllers, sensor gateways, IoT platforms, or industrial protocol interfaces. |
Typical Use Cases of Real-Time Data Sources
Scenario Type | Description |
Dynamic Monitoring | Collect real-time equipment data (e.g., temperature, speed, position) to synchronize digital twin behavior. |
Real-Time Decision Support | Use fresh data for production scheduling, fault prediction, or energy optimization. |
Configuring Data Processing and Transformation Rules
Before an adapter instance runs, you must configure the data processing logic to ensure that the collected data can be properly recognized, cleaned, and stored by the system.
Creating an Adapter Template (Optional)
An adapter template standardizes the processing workflow, making it reusable across multiple instances and reducing repetitive configurations. The template content is a Node-RED flow in JSON format.
Note: If no reuse is needed, you can skip this step and configure the flow directly in the instance.
Steps
- In DFS Adapter > Adapter Template, click [New].
- Enter a template name and paste the JSON-formatted Node-RED flow into the input field.
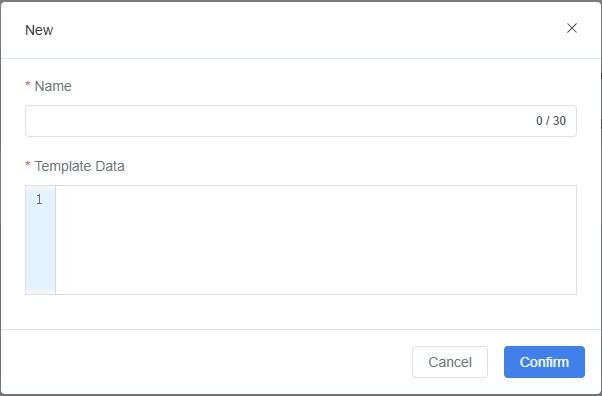
- Click [Confirm] to save the template.
Editing Data Processing Flows (Node-RED)
Node-RED is a visual flow editor used to configure data collection, parsing, and transmission logic.
Steps
- Access the Node-RED interface of the adapter instance in your browser.
- On the flow canvas, configure parameters such as data collection frequency, field processing, and output format.
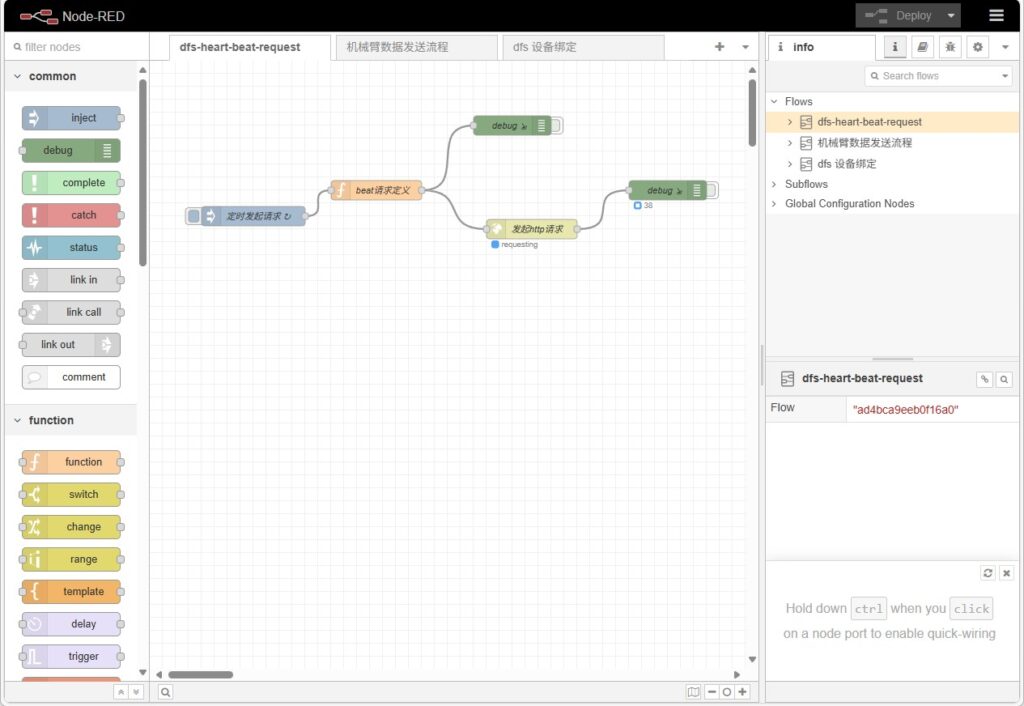
- After editing, click [Deploy] to apply the flow to the running adapter service.
For detailed operations, refer to the Node-RED User Guide.
Creating an Adapter Instance
An adapter instance serves as the configuration entry point for connecting to a specific data source. Each instance represents a distinct data ingestion task with independent listening addresses, ports, and processing logic.
Creating an Instance
Steps
- In DFS Adapter > Adapter Instance, click [New] to create a new adapter instance.
- In the pop-up window, fill in the following information:
Field | Description |
Name | Custom name for the adapter instance for easy identification. |
Secret Key for Edge Device (Optional) | Used for edge device authentication to enhance data security. |
IP | Managed IP of the DFS Adapter service. |
Port | Port used by the adapter instance. |
IP and Port Configuration Notes
- Single Machine with Multiple Instances: Same IP address, different ports.
- Multiple Machines: IP addresses differ according to actual devices; each instance uses its own IP.
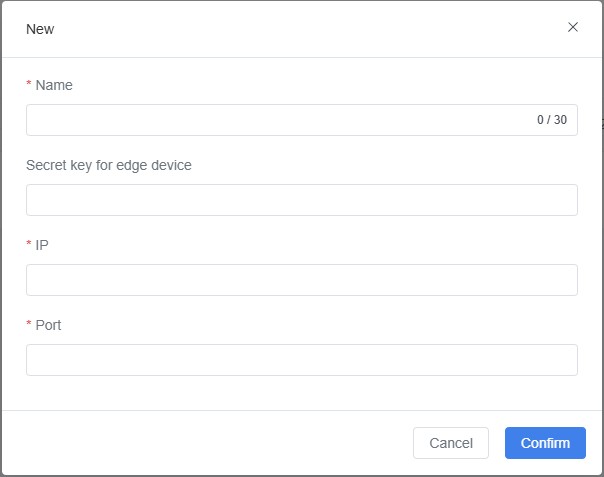
- After completing the form, click [Confirm].
Binding an Adapter Template (Optional)
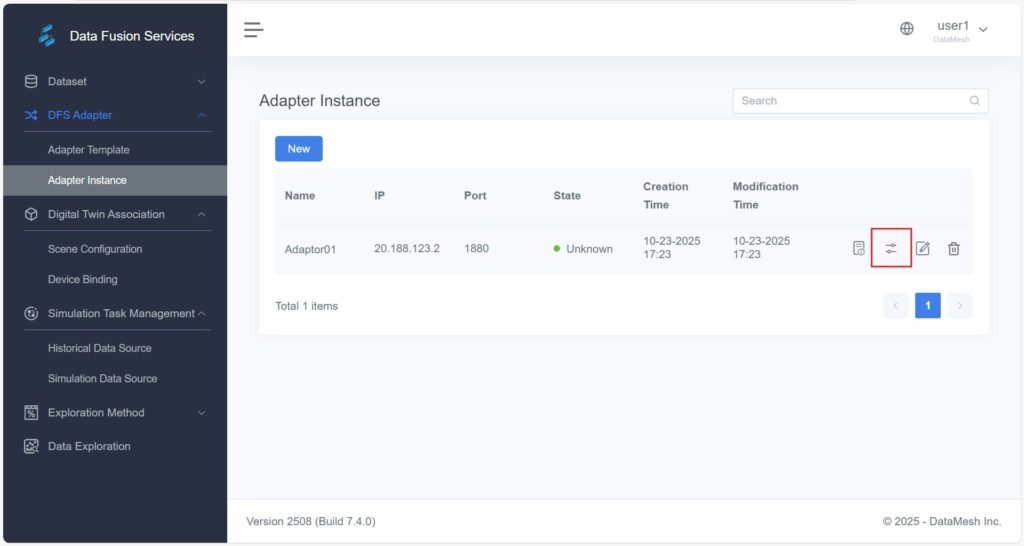
In DFS Adapter > Adapter Instance, click [Select Template] ![]() for the target adapter instance and choose a template to set up its data processing rules.
for the target adapter instance and choose a template to set up its data processing rules.
Editing Node-RED Flows
This section provides guidance for internal developers on how to safely modify, extend, or update Node-RED data flows within a deployed DFS environment.
- Prerequisites
Before modification, ensure the following conditions are met:
- Node-RED has been successfully deployed and is accessible via browser (default address: http://<server-ip>:1880).
- You are familiar with Node-RED basics (nodes, connections, deploy button).
- You have valid DFS platform credentials and key identifiers (e.g., edgeId, digitalTwinId).
- You have backed up the existing flow (recommended via “Export JSON”).
- Flow Structure Overview
A standard DFS Node-RED flow typically includes three main parts working together:
- DFS Heartbeat Flow: Periodically sends heartbeat signals to the DFS platform to confirm node status.
- Device Binding Flow: Retrieves device-to-digital-twin mappings from Redis and stores them in global cache.
- Device Data Flow: Receives or simulates raw device data, maps it to digital twins, and sends it to DFS Server (for storage) and the frontend (for visualization) via MQTT.
- Key Parameters
Parameter | Description | Example | Notes |
edgeId | Unique identifier for the edge node (assigned by DFS) | 68979c3e78f3d473c54e0cd9 | Must match platform configuration |
edgeName | Display name for the node | nodered | Customizable |
DFS Heartbeat URL | Target URL for heartbeat requests | https://<dfs-server>/api/dfs/instance/beat | Required |
tenantId | Tenant identifier | c299600a2e86b582746956d23e132b690 | Verify with DataMesh support |
digitalTwinId | Unique identifier of the digital twin | 600ab3a6391d44c499da0babe90f9e1f | Obtain from Digital Twin Details page |
- Data Topics
Node-RED uses different topics to send data to the backend and frontend:
- /DFS/telemetry/{edgeId} – Sends telemetry data to DFS Server (Artemis).
- /DFS/{tenantId}/{digitalTwinId} – Sends data to the frontend via EMQX to drive real-time visualization.
- Data Format Requirements
DFS interfaces typically accept JSON-formatted data. Recommended structure:
[ { “serial”: “Device name”, “ts”: 63, “datas”: { “key1”: “data1”, “key2”: “data2” } } ] |
Field Descriptions
- serial: Device name or serial number (must match binding record).
- ts: Timestamp (milliseconds).
- datas: Key-value pairs of device attributes and their values.
⚠️ Important: Attribute names in datas must match those configured for the digital twin in DFS. If not, you can use the platform’s manual binding feature for mapping.
- Common Modifications
Node Type | Purpose | Editable Parameters | Example |
Inject | Timed triggers (heartbeat / data collection) | Interval | Heartbeat every 10s, data every 1s |
File in | Reads data from file | File path | /home/user/device.json |
MQTT in | Subscribes to MQTT data | Broker address, topic | mqtt://192.168.1.100:1883, robot/pose |
Kafka in | Subscribes to Kafka topic | Broker address, topic | kafka://broker1:9092, device-data |
Function | Data formatting or field mapping | JavaScript logic | Convert temp:28.5C → { “temperature”: 28.5 } |
HTTP request | Uploads data to DFS | URL | https://<dfs-server>/api/dfs/data |
MQTT out | Publishes data to message queue | Broker address, topic | ws://192.168.2.80:83 / 192.168.2.60:1884 |
- Connection Configuration
Ensure the following connection nodes are correctly configured, especially when switching between environments (e.g., test and production):
- MQTT out (Frontend)
- Example Address: ws://192.168.2.80:83
- Configuration Name: emqx-mqtt
- MQTT out (DFS Server)
- Example Address: 192.168.2.80:1884
- Configuration Name: artemis-mqtt
- Redis Data Source
- Example Address: 192.168.2.80:6379
- Used to periodically fetch device–twin mapping data (key format: dfs:device:<serial>).
- MQTT out (Frontend)
Digital Twin Association
The Digital Twin Association module is used to map and bind physical device data to digital twins, enabling data-driven simulation, interaction, and business optimization.
Through this function, enterprises can build digital twin models that closely reflect real operational conditions to support maintenance, monitoring, and analytics.
Importing a Digital Twin Scene
You must import the scene containing the target digital twin from the FactVerse platform into DFS as the foundation for subsequent data binding.
Steps
- Create a Digital Twin Scene
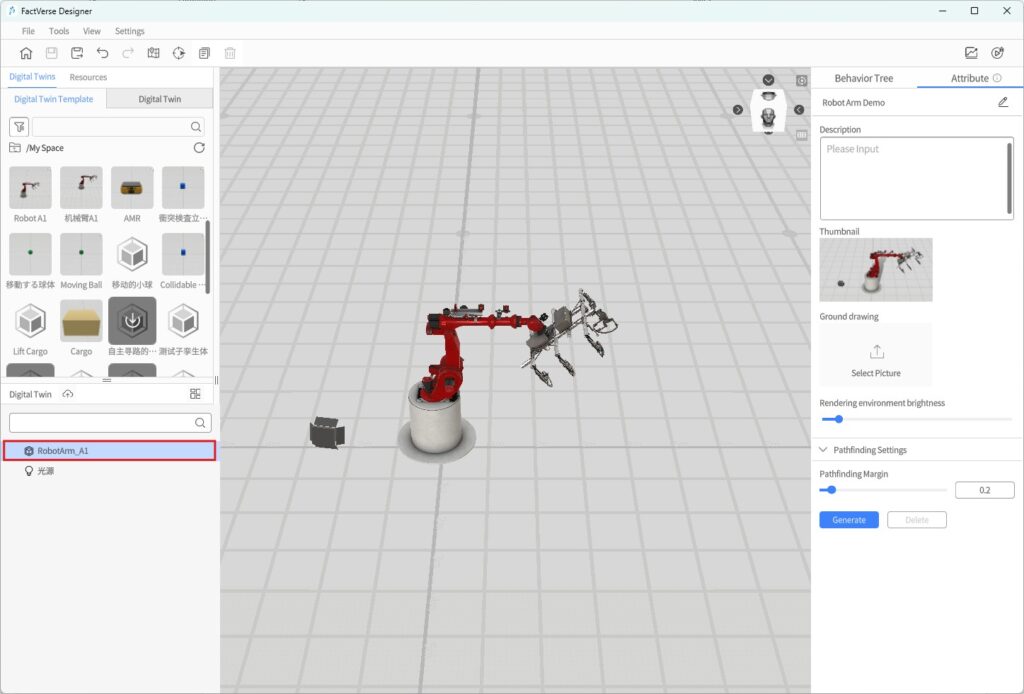
Use FactVerse Designer to create a digital twin scene that includes the digital twins corresponding to your physical devices.
- Example: Create a scene named “Robot Arm Demo,” which contains a digital twin named “RobotArm_A1” for later data binding.
- Import the Digital Twin Scene
a) Log in to the DFS
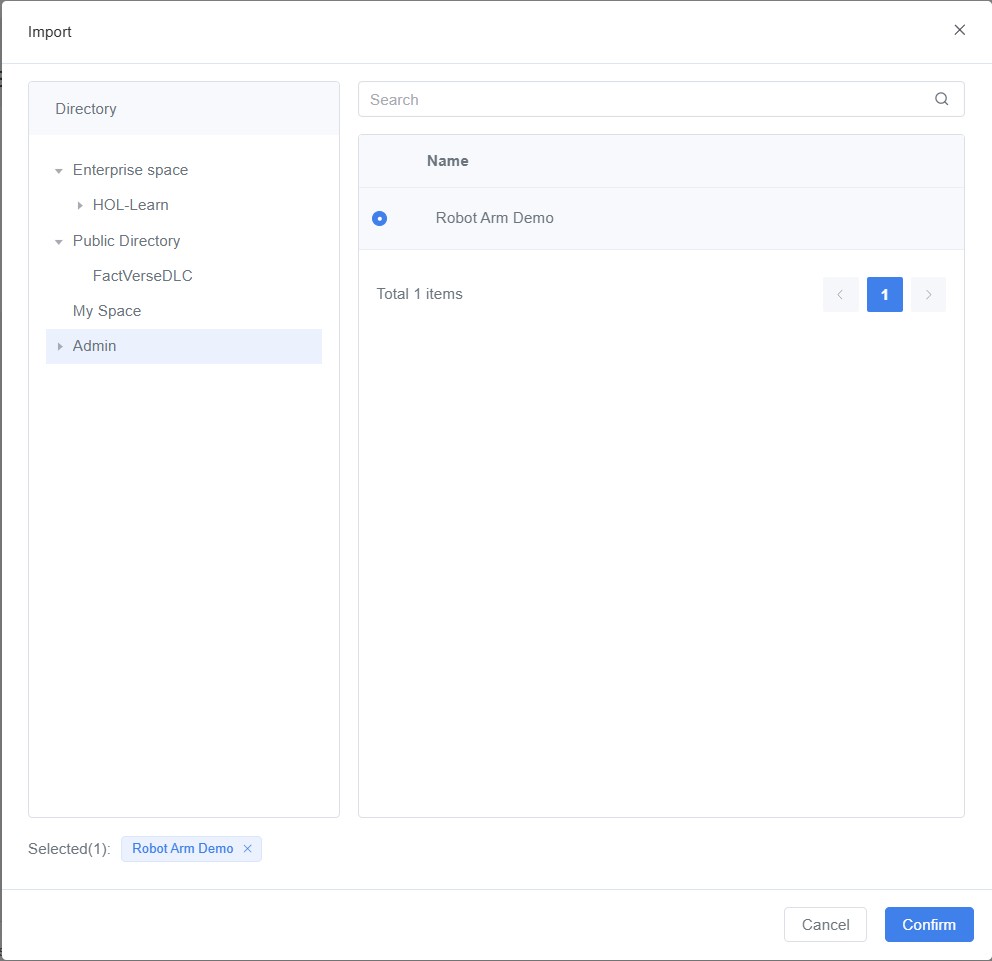
b) Navigate to Digital Twin Association > Scene Configuration, then click [Import] to open the import window.
c) In the import window, select the desired scene (e.g., “Robot Arm Demo”) and click [Confirm] to complete the import.
Binding Devices and Digital Twins
Binding real devices to digital twins is a critical step in achieving data-driven simulation and real-time synchronization.
Once the binding is complete, device data will drive the corresponding digital twin attributes, forming a closed feedback loop between the physical and virtual environments.
Prerequisites
- The scene containing the target digital twin has been imported.
- The device has been added (see the methods below).
Device Addition Methods
Method | Description |
Import via Device Binding Page | Manually create a device for connection to real equipment or simulated data. |
Import When Creating an Adapter Instance | Automatically generate device information during real-time data integration. |
Device–Twin Binding Procedure
- Open Device Details
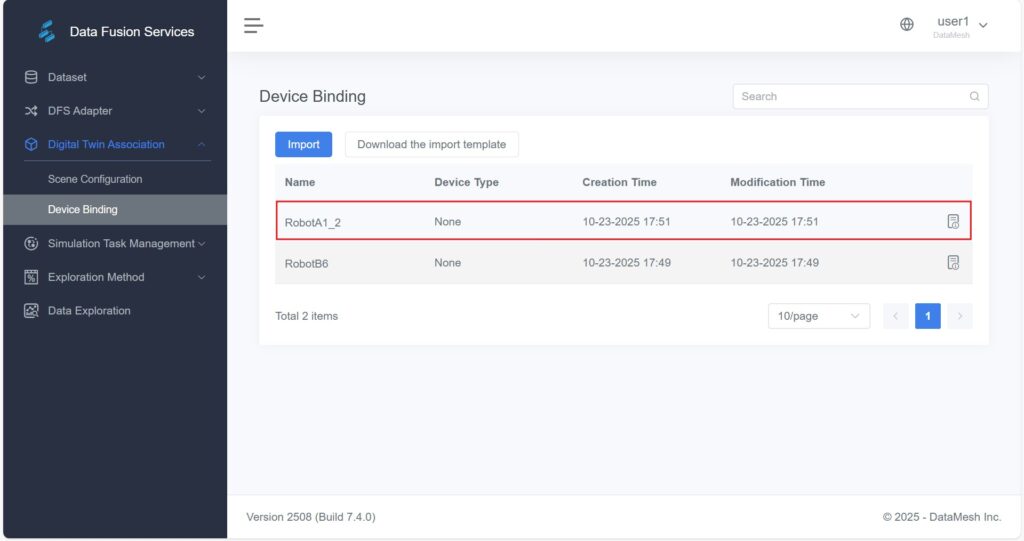
On the Digital Twin Association > Device Binding page, find the target device (e.g., “RobotA1_2” imported via the Device Binding page) and open its Details page).
- Open the Digital Twin Configuration Window
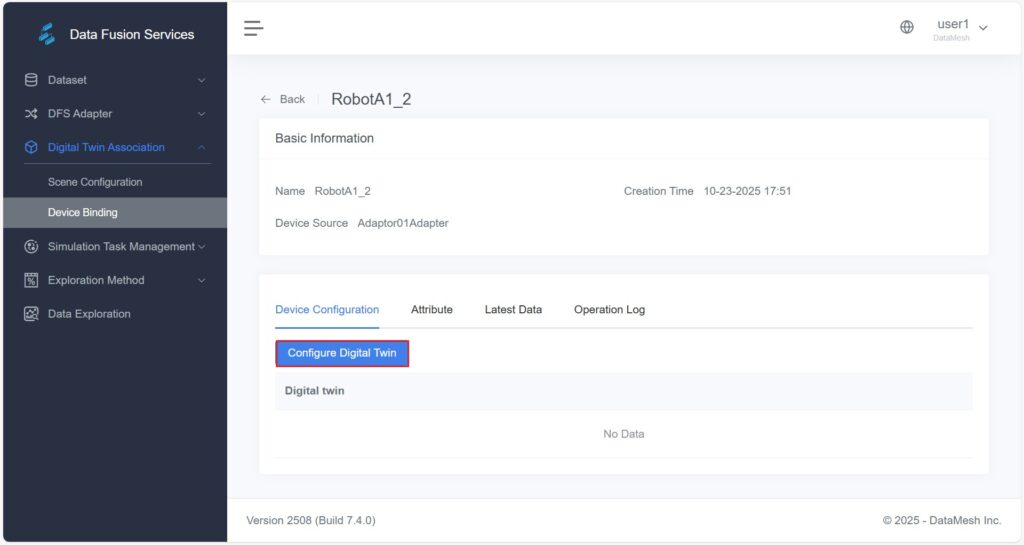
In the device configuration panel, click [Configure Digital Twin] to open the configuration window.
- Select a Digital Twin
a) In the configuration window, click the button corresponding to the scene that contains the device.
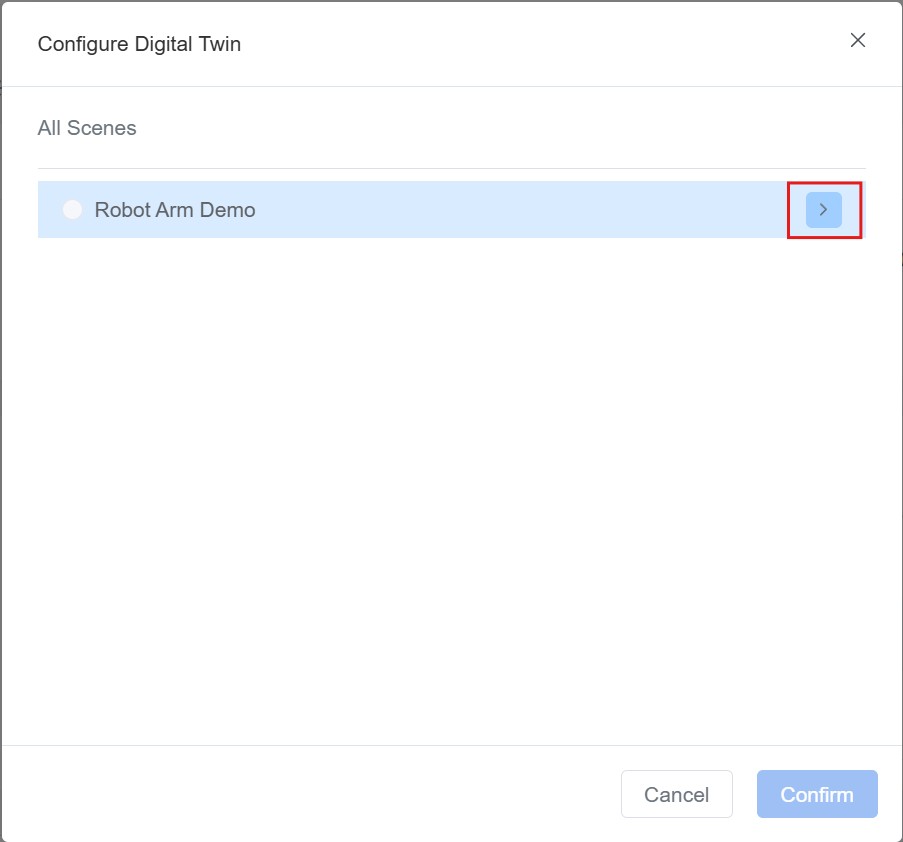
b) Select the digital twin to be bound and click [Confirm] to complete the device–twin binding.
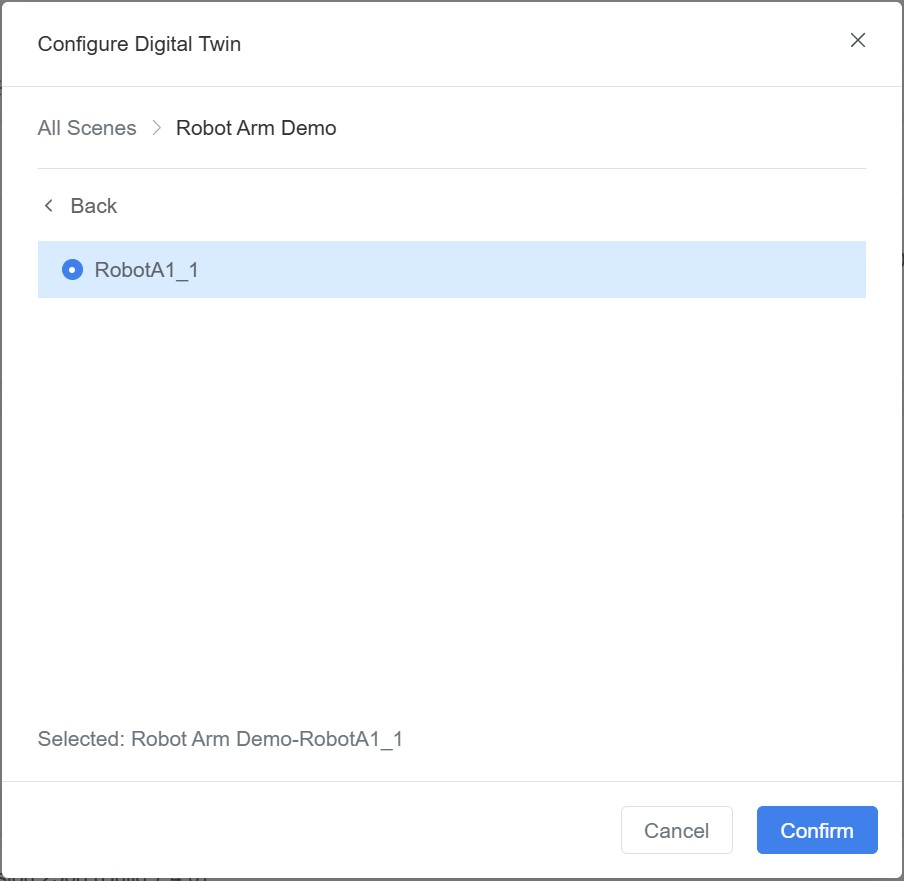
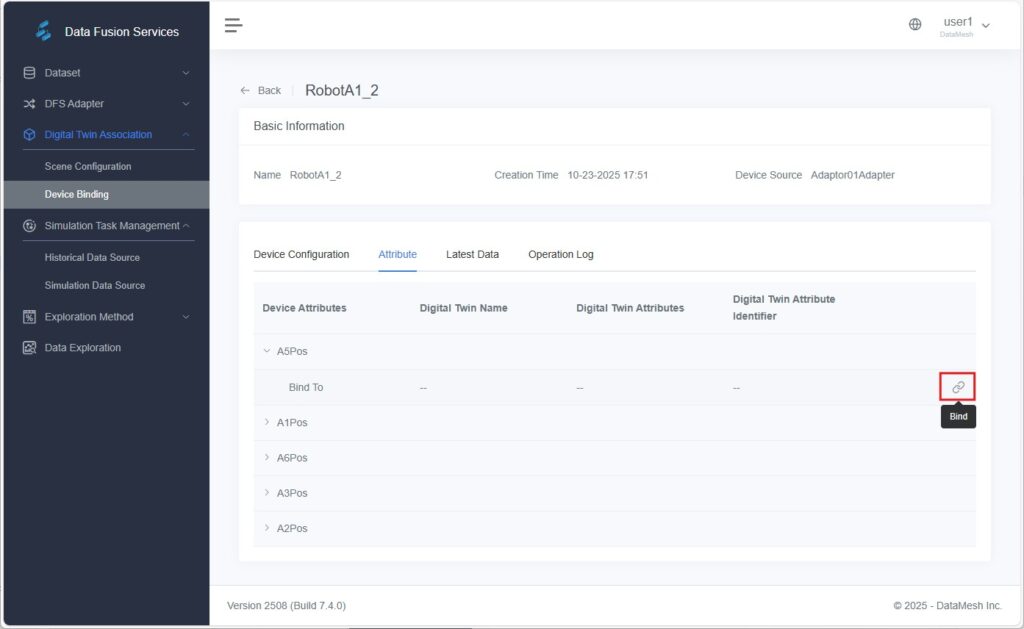
- Attribute Binding (Optional)
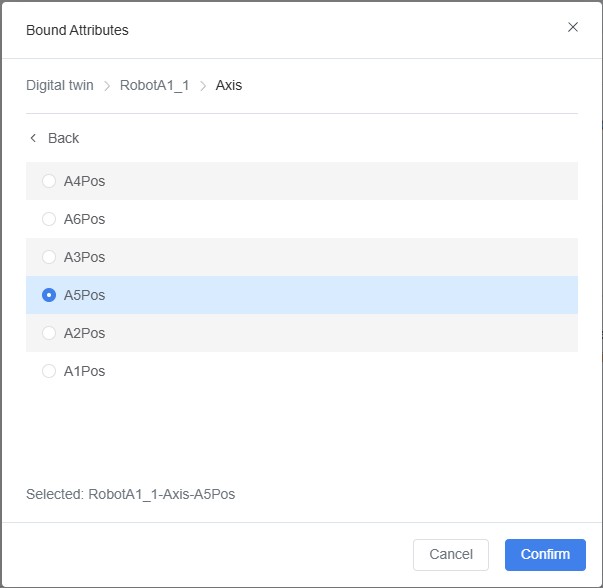
If the attribute names of the device and digital twin are not identical, you must manually bind them to ensure correct data mapping and synchronization. - a) Click the Attributes tab, then click the Bind icon next to the target device attribute.
b) In the pop-up Bind Attribute window, select the corresponding twin attribute and click [Confirm].
Verification
Open the scene “Robot Arm Demo” in FactVerse Designer.
Click Debug Playback and observe the robot arm’s movement to confirm that its posture and actions respond dynamically to live device data.
Dataset Management
The Dataset module provides a unified interface for importing, organizing, categorizing, and analyzing data.
It serves as the foundation for data exploration, intelligent analytics, and visualization within the DFS platform.
General Dataset Page
The General Dataset page enables centralized management of data resources from various sources, supporting subsequent data exploration, modeling, and analytical tasks.
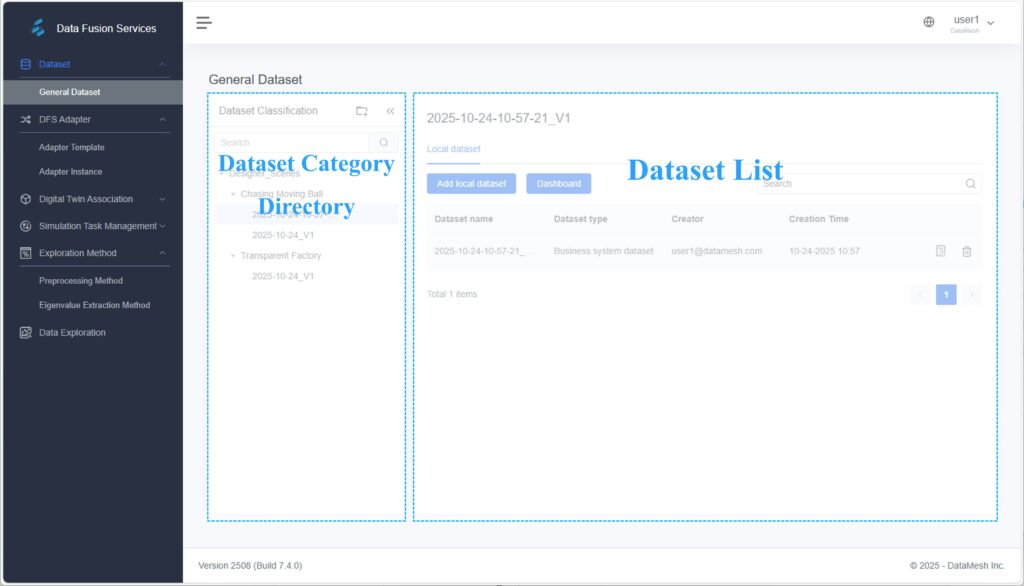
Dataset Category Directory
The left panel displays the dataset category directory, which allows users to group datasets for structured organization and full-process traceability of data workflows.
Operation Guide
Operation | Description |
| Hover over a category name and click [Add Subcategory] to create a subfolder. |
| Hover over a category name and click [Edit] to rename it. |
| Only empty categories (without subcategories) can be deleted. Delete all subcategories first if necessary. |
| Use keyword fuzzy search to quickly locate a target category. |
Dataset List
When a category is selected from the left panel, the right panel displays all datasets under that category, including the following information:
- Dataset Name
- Dataset Type (Local Dataset / Data Source Dataset / Exploration Dataset)
- Creator
- Creation Time
Dataset Types
Datasets are categorized by source into three types:
Type | Description | Typical Use Case |
Local Dataset | A .csv file manually uploaded by the user. | Quickly import and analyze offline data. |
Data Source Dataset | Data imported from external business systems or simulated data generated and uploaded by FactVerse Designer. | Behavior simulation, production monitoring, digital twin data synchronization. |
Exploration Dataset | A result set generated from automated or manual data exploration tasks. | Data analysis, alert rule configuration, and result output. |
Dataset List Area — Functional Description
Function | Description |
Add Local Dataset | Click [Add Local Dataset] to upload a .csv file. The system will automatically parse it and create a dataset. |
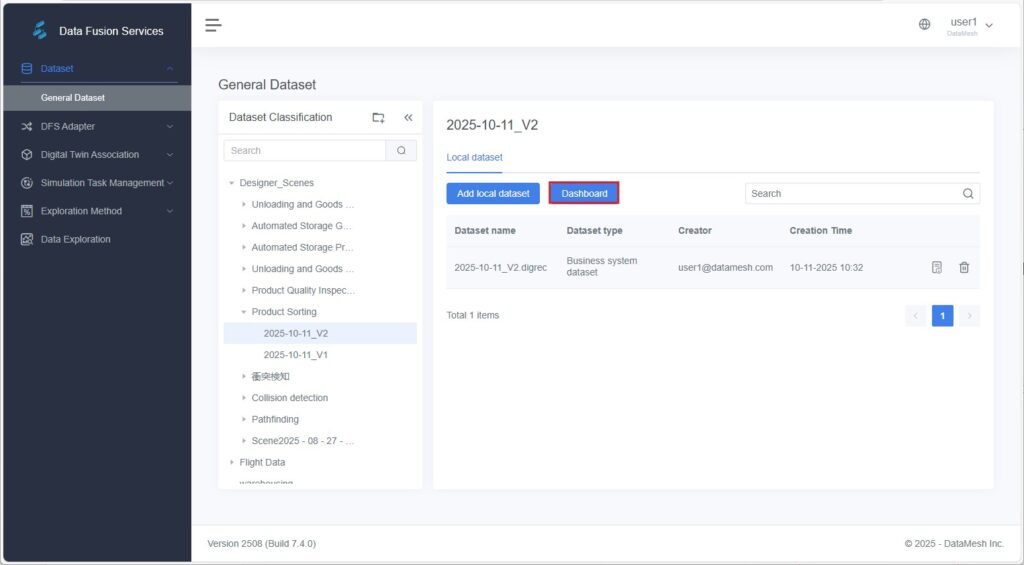
Data Dashboard | Click [Data Dashboard] to open the data visualization and configuration interface for chart setup and interactive analysis. |
Search Dataset | Search datasets by name, type, or time range to quickly locate the target dataset. |
View Data | Click the Details button of a dataset to open its data view page for analysis, table viewing, and further operations. |
Delete Dataset | Delete the selected dataset. ⚠️ This action is irreversible. Proceed with caution. |
Creating a Local Dataset
On the General Dataset page, users can quickly create a local dataset by uploading a .csv file for subsequent data analysis tasks.
Steps
- Select a Dataset Category
In the left category directory, select a folder where the new dataset will be stored.
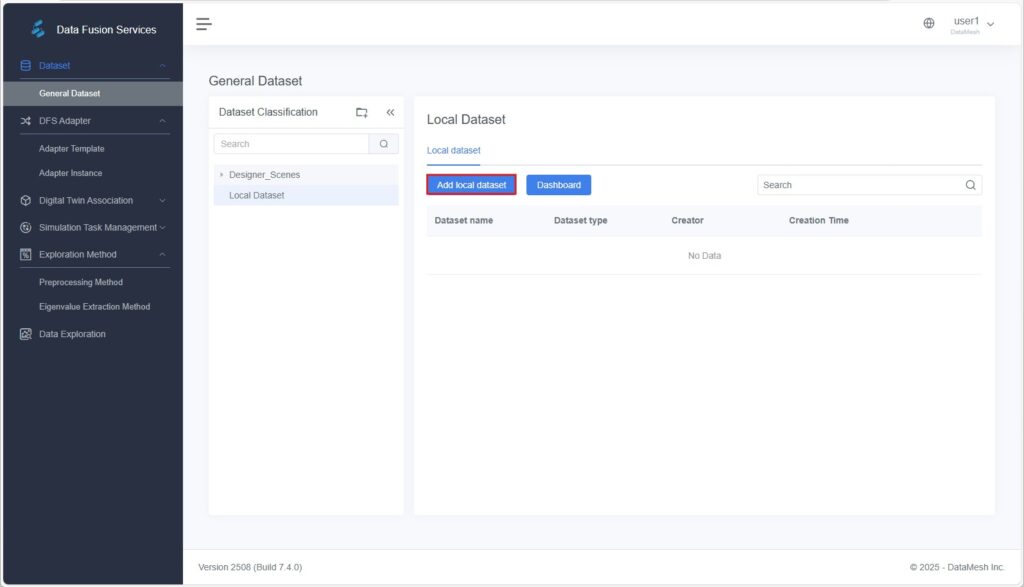
If no suitable category exists, create one first before continuing. - Click [Add Local Dataset]
Click [Add Local Dataset] in the top-right corner of the page to open the creation window.
- Enter Basic Dataset Information
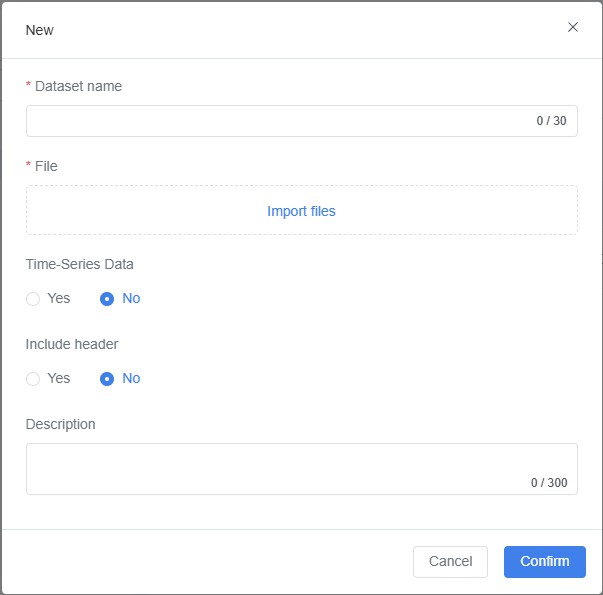
In the pop-up window, fill in the following fields:- Dataset Name
- Description (optional)
- Import the CSV File
Click [Import File] and select a local .csv file to upload.
Note: Ensure that the CSV file is correctly formatted, with standardized fields and complete data, to allow successful import.
- Set Dataset Options
- Time-Series Data: Check Yes if the dataset contains timestamps and is intended for time-based analysis.
Example: A device that records its rotational speed every 5 minutes represents typical time-series data. - Include Header: Check Yes if the first row of the CSV file contains field names; otherwise, check No.
- Time-Series Data: Check Yes if the dataset contains timestamps and is intended for time-based analysis.
- Click [Confirm]
The system automatically parses the CSV file and generates the corresponding data fields.
Once created, the dataset will appear under the selected category directory.
Data Viewing
On the General Dataset page, click a dataset name or the Details button on the right to open the Dataset View page.
The Dataset View page contains three tabs — Data Entries Table, Data Analysis, and Field Management — allowing users to view, filter, and analyze data from multiple perspectives.
These tools help uncover data patterns and provide a solid foundation for data modeling, alert configuration, and other advanced operations.
Data Entries
On the General Dataset page, select the target dataset and click its name or Details to enter the Data Viewing page.
By default, the system opens the Data Entries tab.

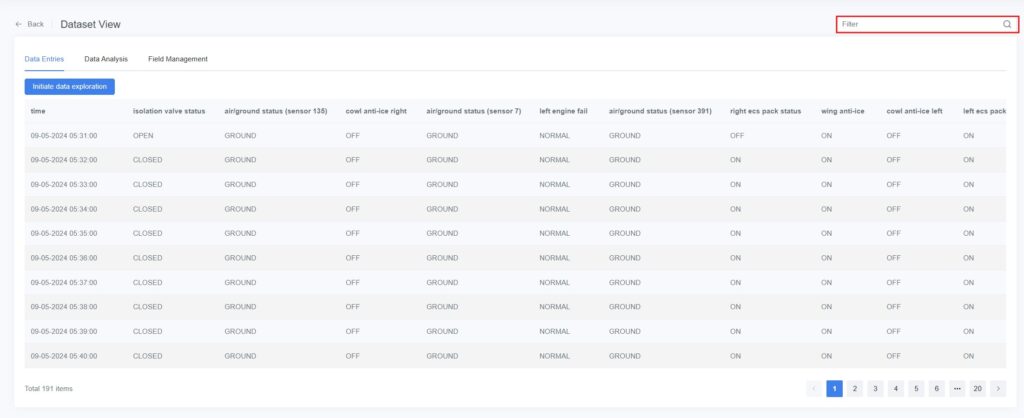
The Data Entries tab displays raw data in a tabular format, suitable for:
- Precisely verifying individual data values.
- Comparing multiple parameters.
- Reviewing data changes over time.
Functions
- The table is sorted by time in ascending order by default, with parameter filtering available as needed.
- Each row displays values of the selected parameters; field names can be managed or renamed in the Field Management tab.
- Supports row-by-row data viewing by time, parameter, or other fields.
- Users can directly initiate a Data Exploration task from this tab to analyze specific data points or time ranges (see Starting Data Exploration).
Parameter Filtering Steps
- In the Data Entries tab, click the Filter box in the top-right corner.
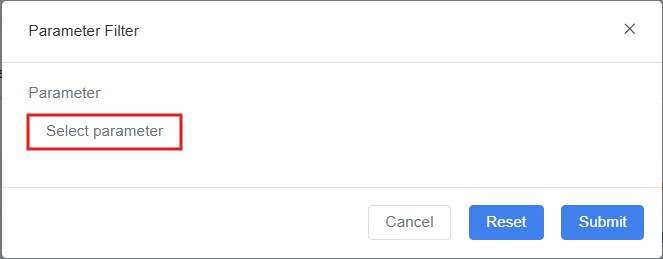
- In the Parameter Filter pop-up window, click [Select Parameter].
- In the Select Parameter window, check the parameters to display and click [Confirm].
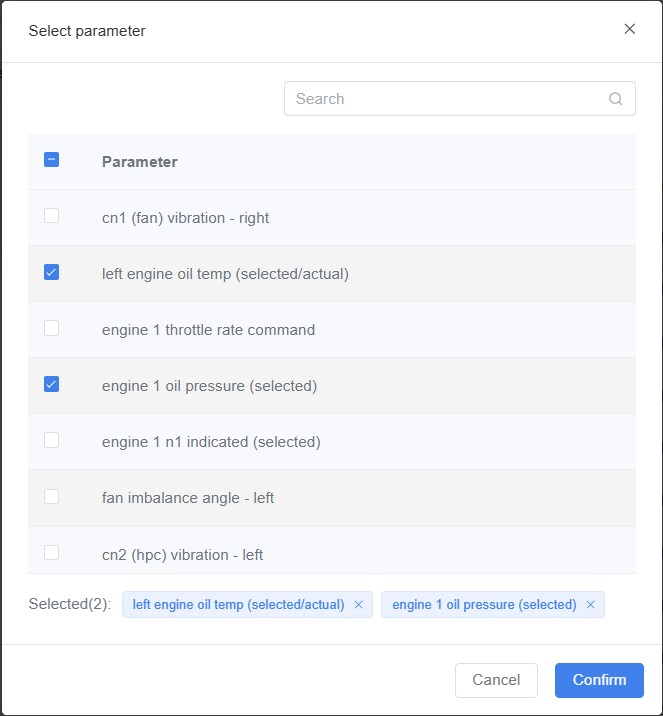
- The data table will refresh to display only the selected parameters.
Data Analysis
The Data Analysis tab is used to explore and analyze time-series datasets.
By configuring charts, users can identify trends, anomalies, and relationships among variables.
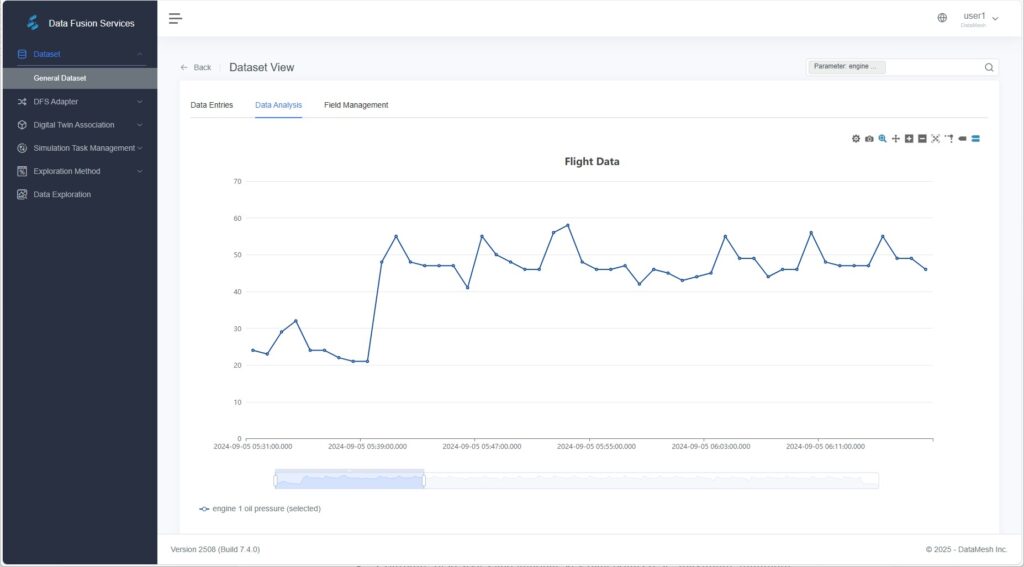
Functions
- Filter and select the fields to analyze.
- Support multiple chart types: scatter plot, line chart, and histogram.
- Configure field styles and annotate key data points (e.g., maximum, minimum, median).
- Support interactive operations such as zooming, dragging, auxiliary lines, data tips, and time range selection.
- Export charts as images for reporting or sharing.
Tip: The page will be blank upon first entry if no configuration exists. If previously configured, the last saved chart will load automatically.
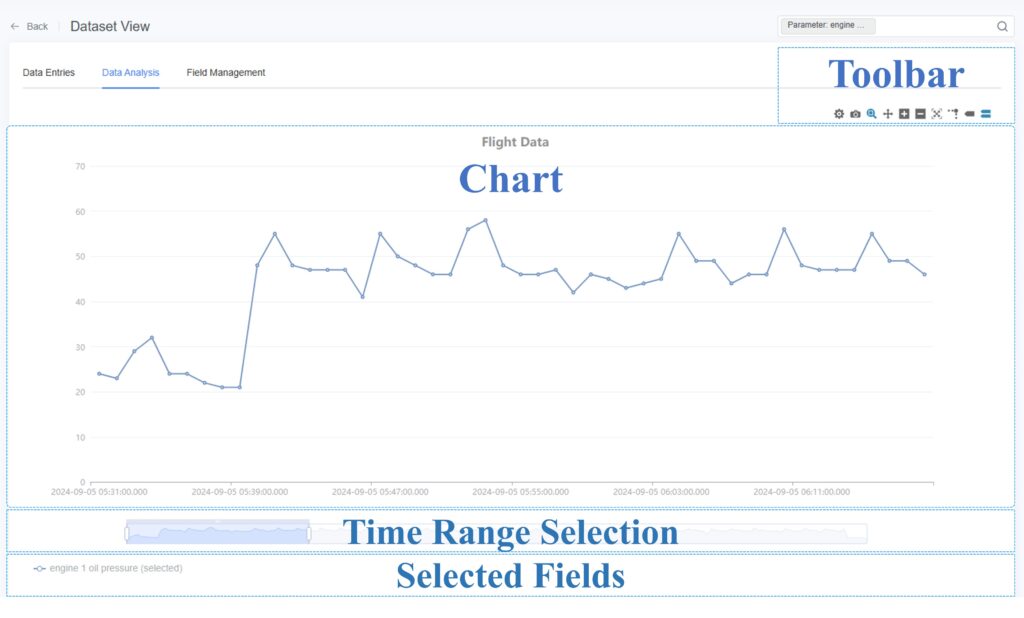

Steps
- Enter Data Analysis
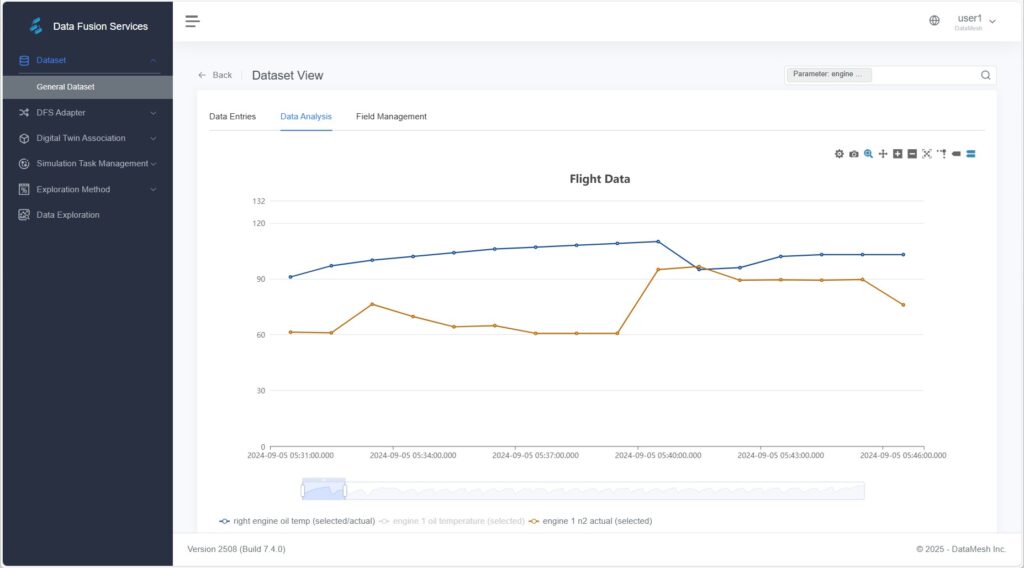
From the General Dataset page, click the target dataset, then switch to the Data Analysis - Filter Parameters to Generate a Chart
a) Click the Filter box in the toolbar.

b) In the Parameter Filter window, click [Select Parameter] to choose fields for visualization.
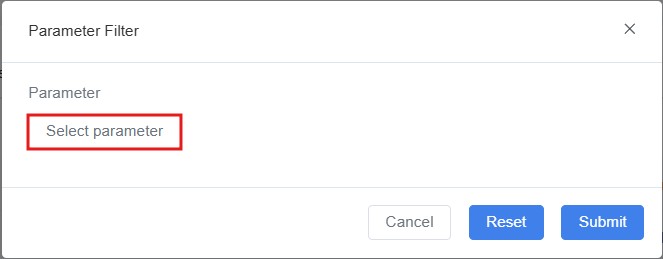
c) Click [Submit]. The system will automatically generate a default line chart.
- Configure Chart Settings
You can manually configure chart types (e.g., scatter plot, line chart, histogram) and fine-tune display options for better visualization.
Click [Data Configuration] on the toolbar to open the configuration panel.
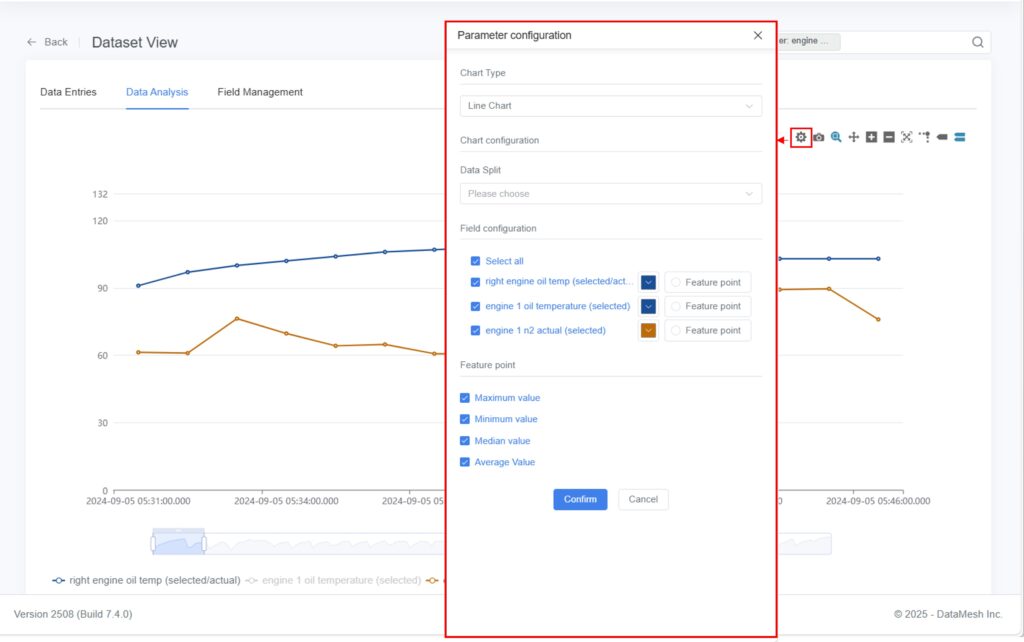
- Chart Type: Choose between scatter plot, line chart, or histogram.
- Data Split: Select parameters to create separate charts for comparative analysis.

- Field Configuration:
- Check the parameters to display and adjust their color and symbol styles.
- Modify field styles (color, line type, etc.) to improve readability.
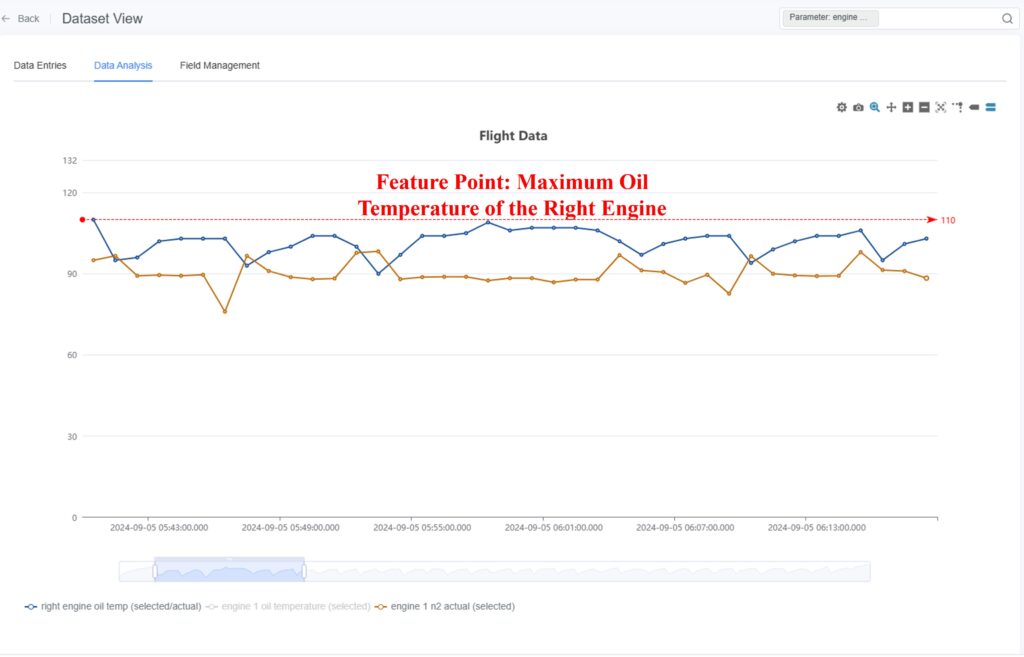
- Annotate Key Points (Optional):
In Field Configuration, enable Feature Points to highlight significant data values such as:- Maximum Value: Marks data peaks for identifying outliers.
- Minimum Value: Highlights low points to reveal downward trends.
- Median Value: Displays central tendency for distribution insight.
Example: The chart below highlights the maximum value for the parameter “Exhaust Gas Temperature (EGT, Right Engine)”.
- Interactive Data Exploration
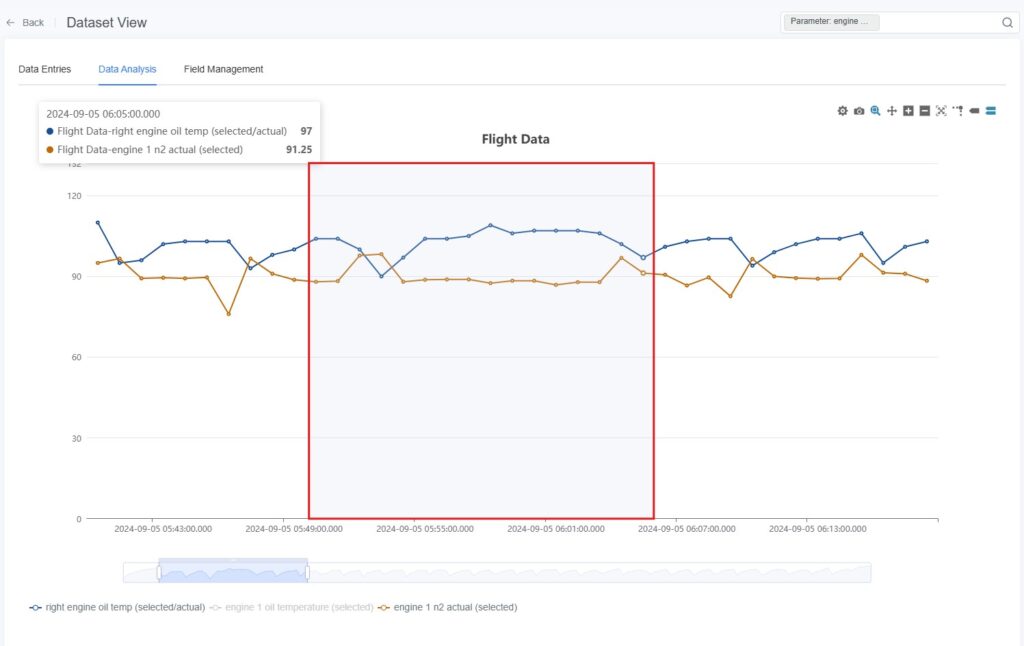
After the chart is generated, you can interact with the visualization using the following tools:- Zoom and Move
- Select Zoom In
 : Click [Select Zoom In], then drag the mouse from top-left to bottom-right to zoom in on a region.
Dragging from bottom-right to top-left reverses the zoom.
- Select Zoom In
- Zoom and Move
- Zoom In
 / Out
/ Out  : Use zoom controls to adjust the scale of the chart for detailed viewing.
 - Drag and Drop
 : Hold the left mouse button to move the chart view horizontally or vertically.
 - Reset
 : Click [Reset] to restore the original display range.
- Zoom In
- Auxiliary Analysis
- Guidelines
 : Hover over a data point to display crosshair lines for precise value comparison.
- Guidelines
- Auxiliary Analysis
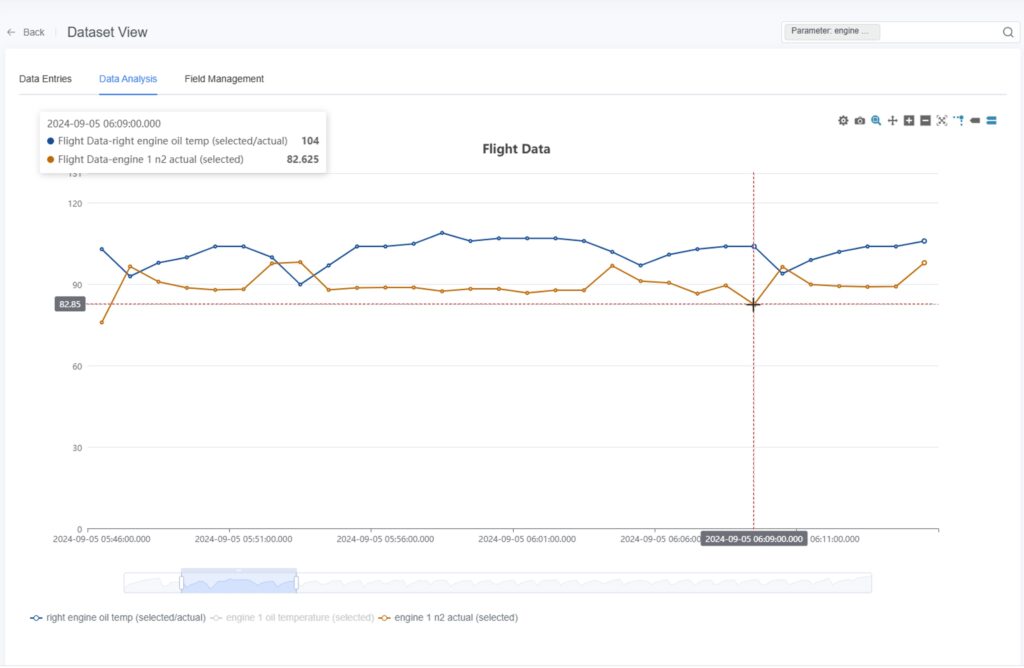
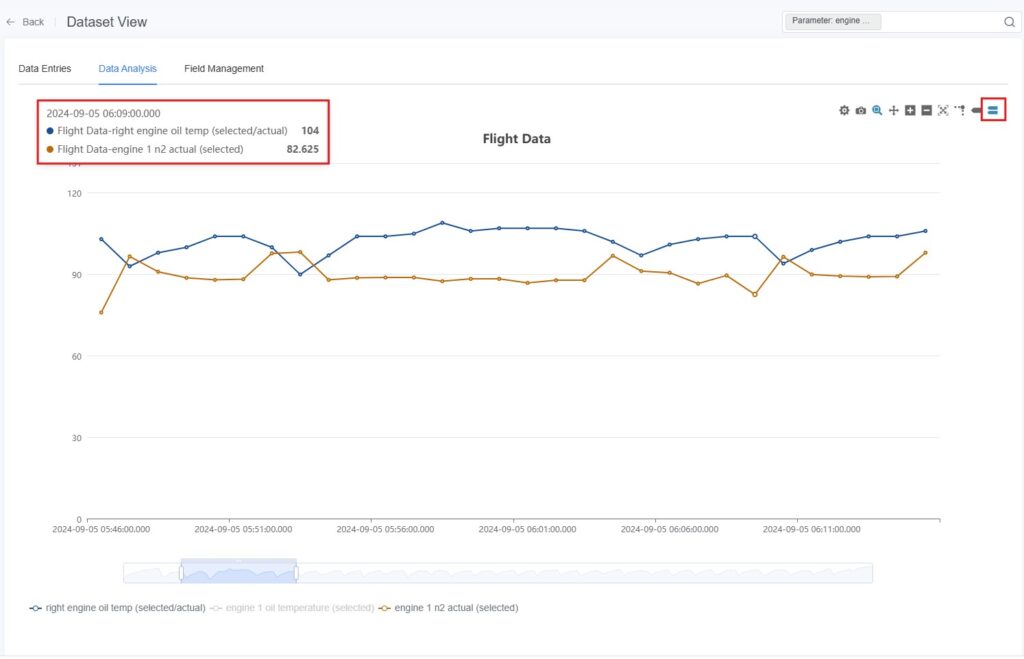
- Single
 / Multi-Column Data
  : Hover over data points to display one or more parameter values at that time.
- Single
- Time Range Selection
- Adjust Display Range: Drag the handles on the Time Range Selector to adjust the visible time window.
- Time Range Selection
![]()
- Select Time Segment: Drag within the selected range to refine the active time segment.
![]()
- Move Time Window: Hover over the top edge of the selector; when the cursor changes to a double arrow, drag to shift the time window without changing its duration.
![]()
- Field Visibility: Click field names below the chart to toggle their visibility on or off.
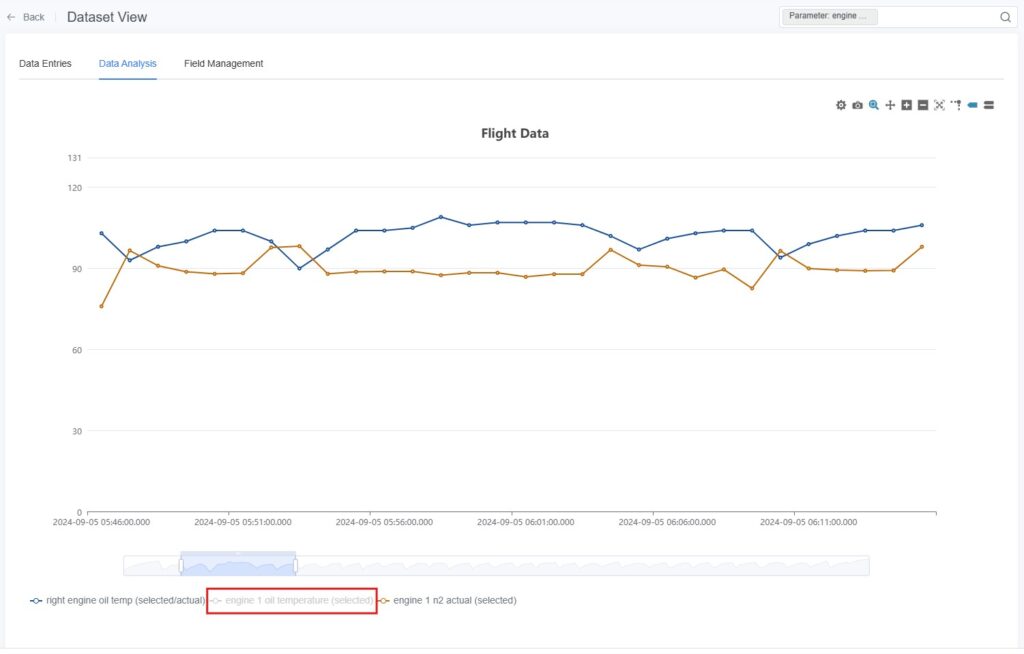
- Export as Image
Click [Export as Image] to save the current chart as an image file for reporting or sharing.
Field Management
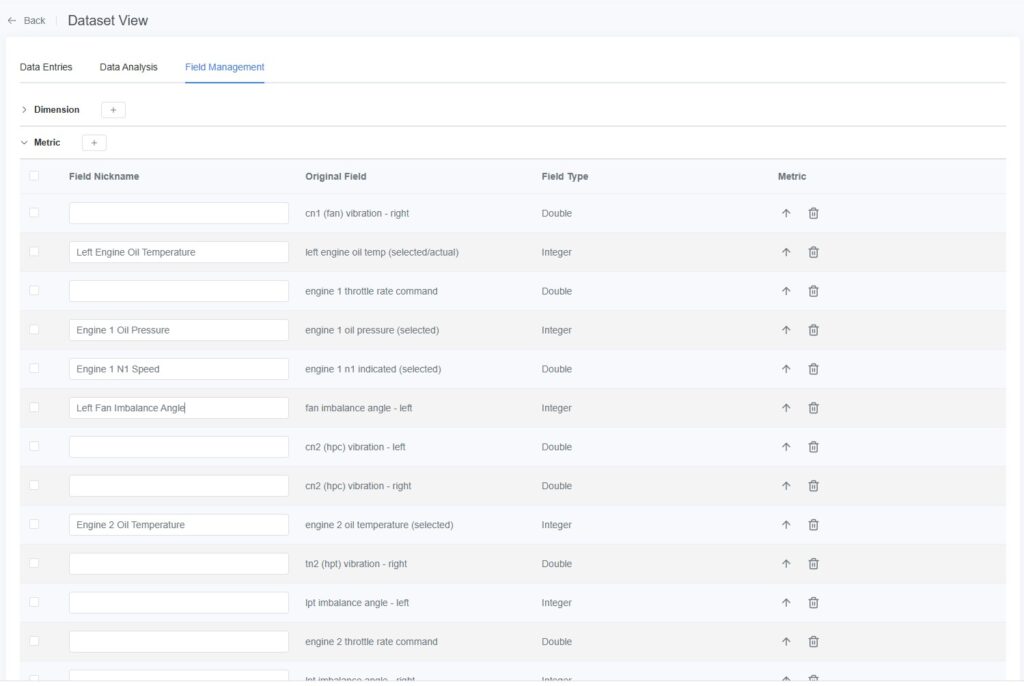
The Field Management tab is used to maintain display names and classification types for dataset fields, making it easier to locate fields in the Data Entries table and Dashboard modules.
Field Classification Rules
The system automatically analyzes and categorizes fields into Dimensions or Metrics:
- Dimensions:
- Text types: CHAR, VARCHAR, TEXT, MEDIUMTEXT, LONGTEXT, ENUM, ANY
- Time types: DATE, TIME, YEAR, DATETIME, TIMESTAMP
- Measures:
- Integer types: INT, SMALLINT, MEDIUMINT, INTEGER, BIGINT, LONG
- Floating-point types: FLOAT, DOUBLE, DECIMAL, REAL
- Boolean types: BIT, TINYINT
Supported Operations
- Edit Field Alias: Assign user-friendly aliases to fields for easier identification in the Data Table and Dashboard.
- Change Field Type:
- Click the Down Arrow icon
 to convert a Dimension into a Measure.
 - Click the Up Arrow icon
 to convert a Measure into a Dimension.
- Click the Down Arrow icon
Note: Text-based dimensions (string type) cannot be converted to measures.
- Delete Field: Supports deleting single or multiple fields.
- Add Field: Supports adding new fields individually or in bulk.
All these operations affect only display and management behavior—they do not modify the original dataset.
The system automatically saves changes after each edit.
Dashboard
The Dashboard allows multiple visual charts to be displayed together on a single page for unified visualization and comparison.
It facilitates trend analysis, anomaly detection, and report presentation.
Unlike Data Analysis, which focuses on ad-hoc exploration of a single dataset, the Data Dashboard can combine charts from multiple datasets, enabling cross-dataset and cross-parameter visualization.
It supports various chart types, including Path Analysis, Collision Statistics, Detail Tables, Pie Charts, Bar Charts, and Scatter Plots.
Data Source Scope
- System-Generated Scene Directories
(e.g., automatically created scene directories from simulation playback):
Dashboards under these directories can reference only datasets within the same directory.
This setup is ideal for comparing multiple simulation results under the same scene.
- Manually Created Directories
Dashboards under these directories can reference datasets from any other directories, allowing flexible analysis that combines data from different sources.
Dashboard Interface

Dashboard Toolbar

Function | Description |
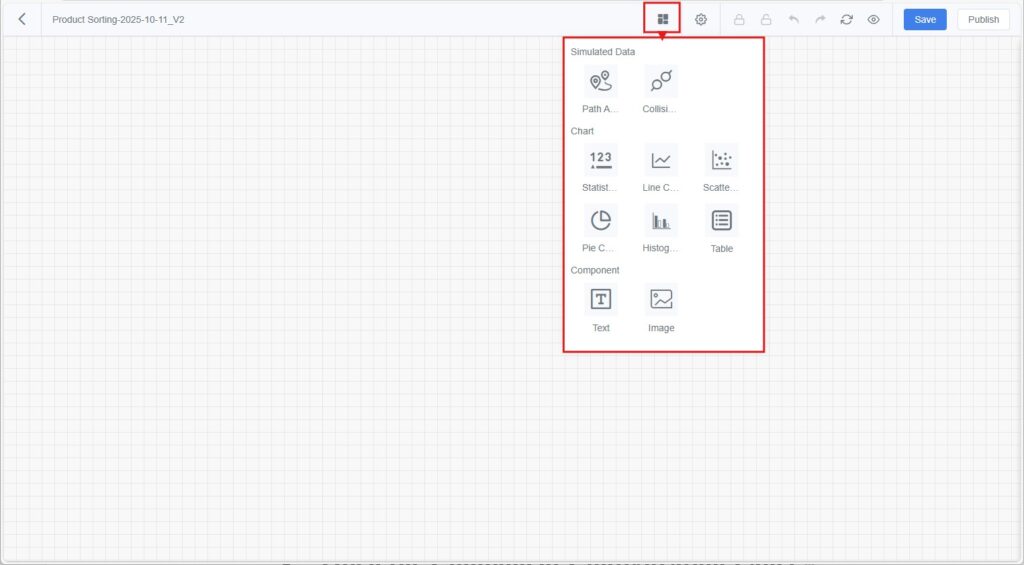
Widget Menu | Click [Widget Menu] to select components to add to the dashboard, such as: Statistical Measure, Bar Chart, Pie Chart, Line Chart, Scatter Plot, Detail Table, Path Analysis, and Collision Statistics. |
Settings | Configure the data refresh frequency of the dashboard. |
Lock | Lock the dashboard to prevent accidental editing. |
Unlock | Unlock a locked dashboard to enable editing. |
Undo | Revert the most recent edit. |
Redo | Reapply the most recently undone edit. |
Reset Canvas | Restore the dashboard layout to its initial state. |
Preview | Enter full-screen mode to preview the dashboard display. |
Save | Save the current dashboard configuration for later editing or viewing. |
Publish | Publish the current dashboard as a template. Once published, newly generated simulation datasets under the same scene directory can automatically apply this dashboard layout. |
Creating a Dashboard
When configuring a dashboard for the first time, you must manually add components and bind datasets.
Later, you can quickly reuse configurations through published dashboard templates.
Initial Configuration
- Open the Dashboard Interface:
In the dataset list, locate the target dataset (e.g., a simulation record generated from Designer playback or a manually uploaded dataset), then click [Dashboard] to open a blank dashboard.
- Add Components:
Click [Widget Menu] and choose the desired component type to add to the dashboard canvas.
- Open the Component Configuration Panel:
Double-click a component to open the configuration panel and set its dataset, fields, and display style. - Save the Dashboard:
Click [Save] to save the configuration for future viewing and editing. - Publish the Dashboard (Optional):
If you want to reuse this configuration in later tasks with similar data structures, click [Publish] to make it a reusable dashboard template.
Conditions for Automatic Template Application
- When a new simulation record is generated via Designer Simulation Playback, DFS saves it as a dataset and automatically assigns it to the corresponding scene directory.
- If a dashboard template already exists under that scene, the system automatically applies the template’s configuration — including layout, field bindings, and filters — to generate a new dashboard.
- ⚠️ Note:
Manually uploaded local datasets or datasets from other sources will not automatically apply templates, even if their fields match. These must be configured manually in the dashboard.
Configuring Dashboard Components
Path Analysis
The Path Analysis component allows users to visualize digital twin motion paths within the data dashboard.
It overlays simulation trajectories on the scene in Designer, combining numerical data with 3D scene visualization.
Features
- Displays all twins that support path analysis from the current dataset and scene in list form.
- Users can select one or more twins in Designer, then click [View 3D results] to open the corresponding scene and visualize the motion paths.
- Only datasets generated from Designer Simulation Playback are supported.
Steps
1. Configure the Path Analysis Component in DFS:
a) In the dashboard’s Widget Menu, select Path Analysis and add it to the canvas.
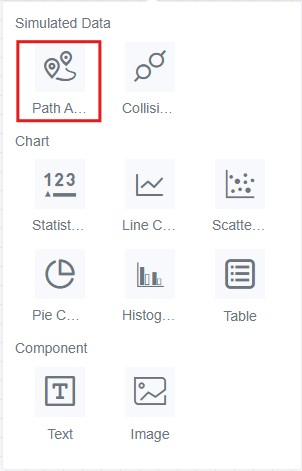
b) Double-click the component and select the dataset to bind (usually a simulation record dataset).
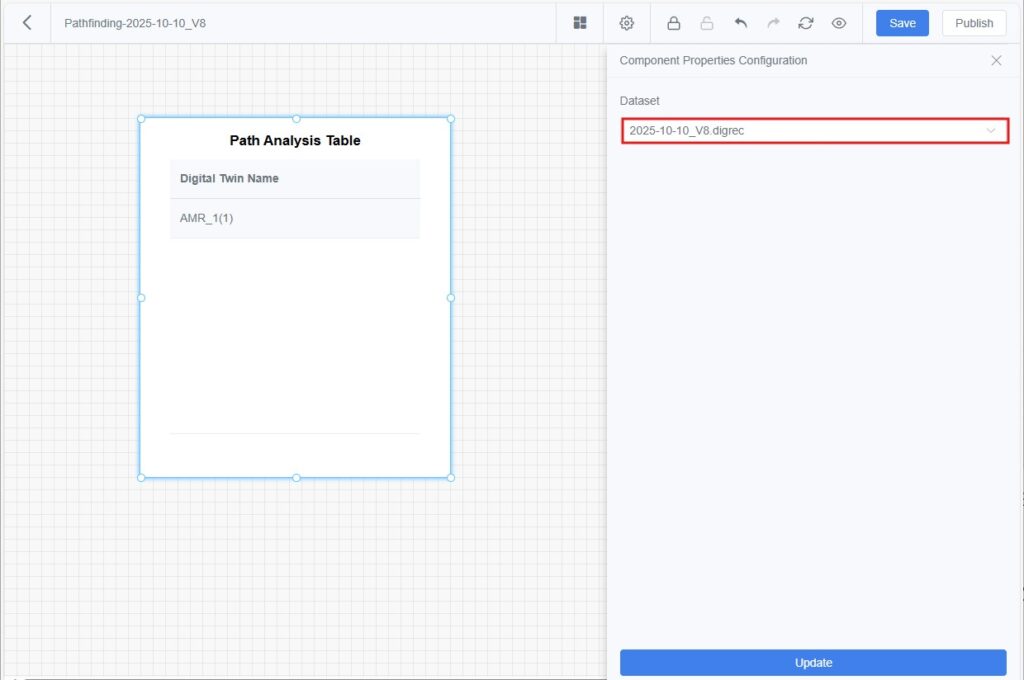
c) Click [Update] to preview, then [Save] to store the configuration.
2. View Path Overlay in Designer:
a) In the main page, click [Simulation Playback] to open the DFS General Dataset
b) Find the target dataset and click [Dashboard] to open its dashboard.
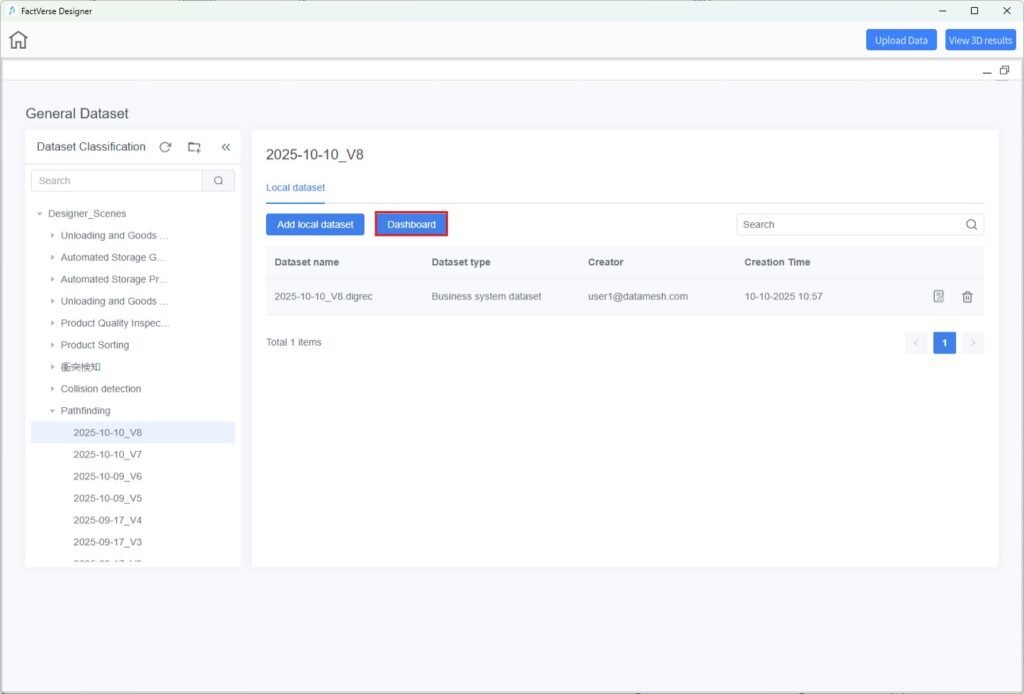
c) On the dashboard canvas, select one or more twins from the Path Analysis
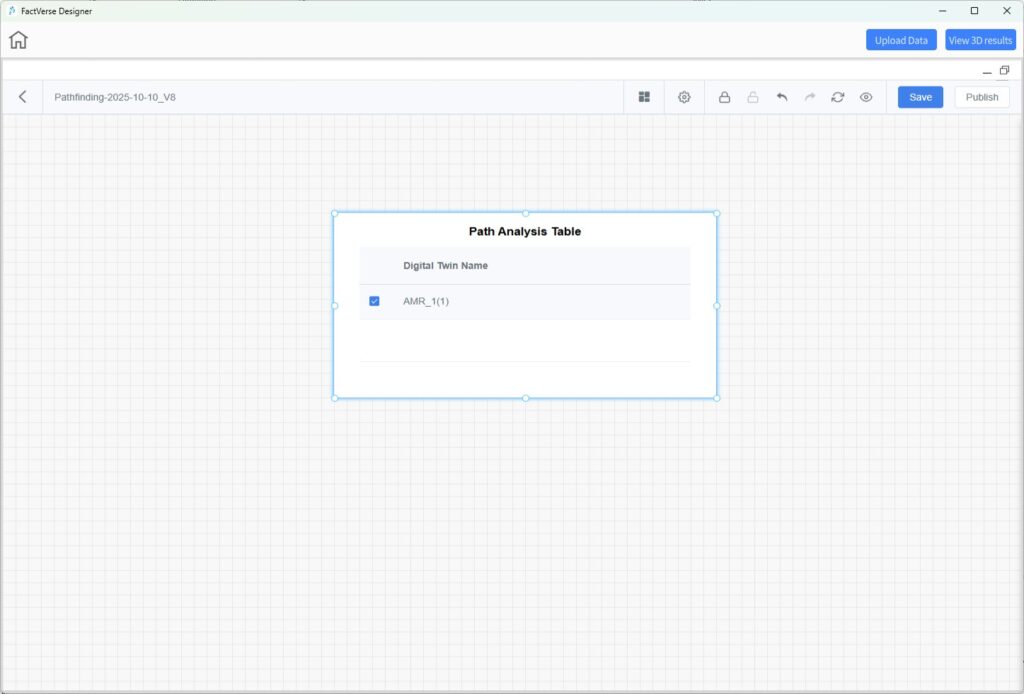
d) Click [View 3D results]. The system loads the corresponding scene in Designer and overlays the paths.
e) To ensure visibility, minimize or move the dashboard window aside to fully view the 3D scene.
Collision Analysis
The Collision Analysis component displays a Collision Statistics detail table showing all recorded collision events in list form.
Steps
- In the DFS dashboard, select Collision Analysis from the Widget Menu and add it to the canvas.
- Double-click the component and select the dataset to bind (typically a simulation playback dataset).
- Click [Update] to preview, then [Save] to store the configuration.
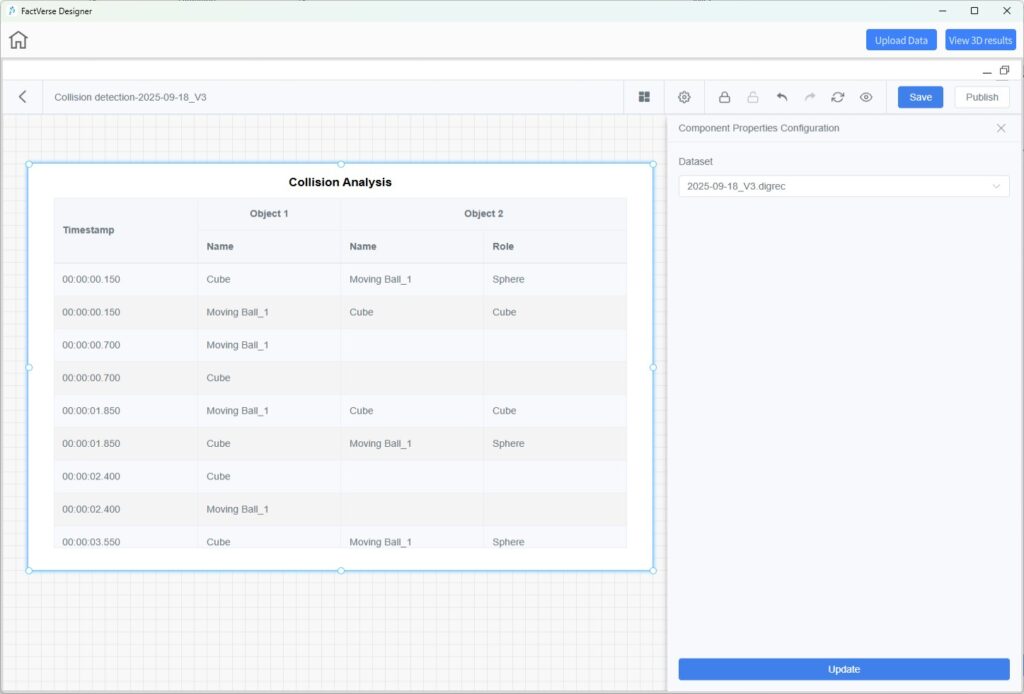
Chart Components
Chart components visualize dataset fields through various chart types, supporting interactive analysis and comparison.
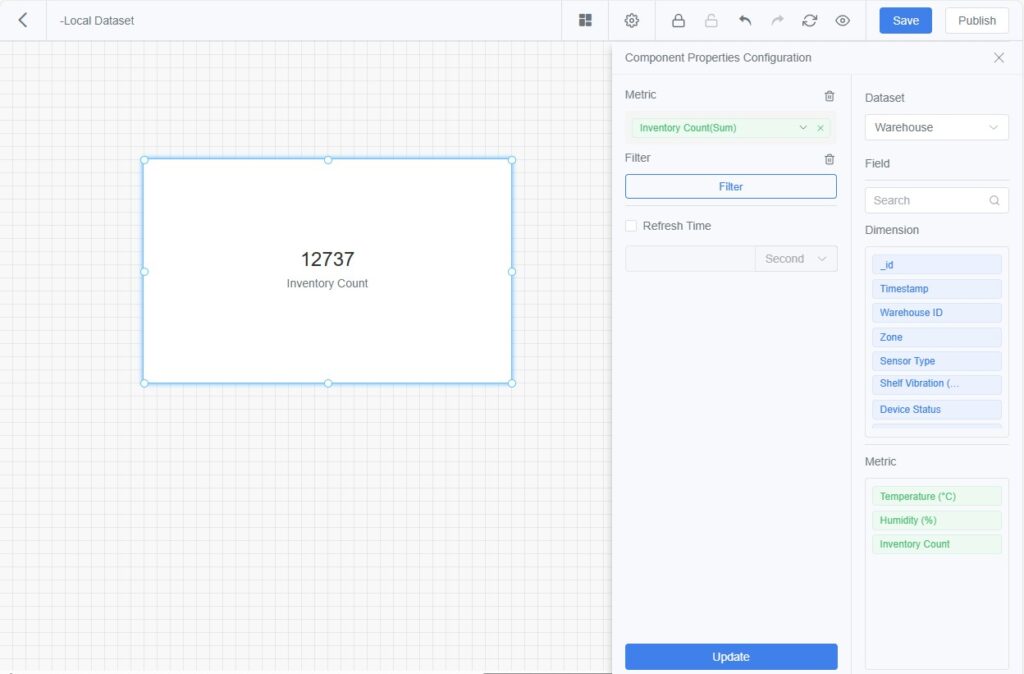
- Statistical Measure:
Displays aggregated results of a measure field (e.g., sum, average, maximum, minimum), allowing users to quickly identify key numerical values.
- Line Chart:
Shows trends of measures over time or across dimensions, helping visualize fluctuations or comparisons.
Supports setting subcategories or dimensions (e.g., comparing temperature trends of multiple devices in a single chart).

- Scatter Plot:
Displays relationships or correlations between two or more measures.
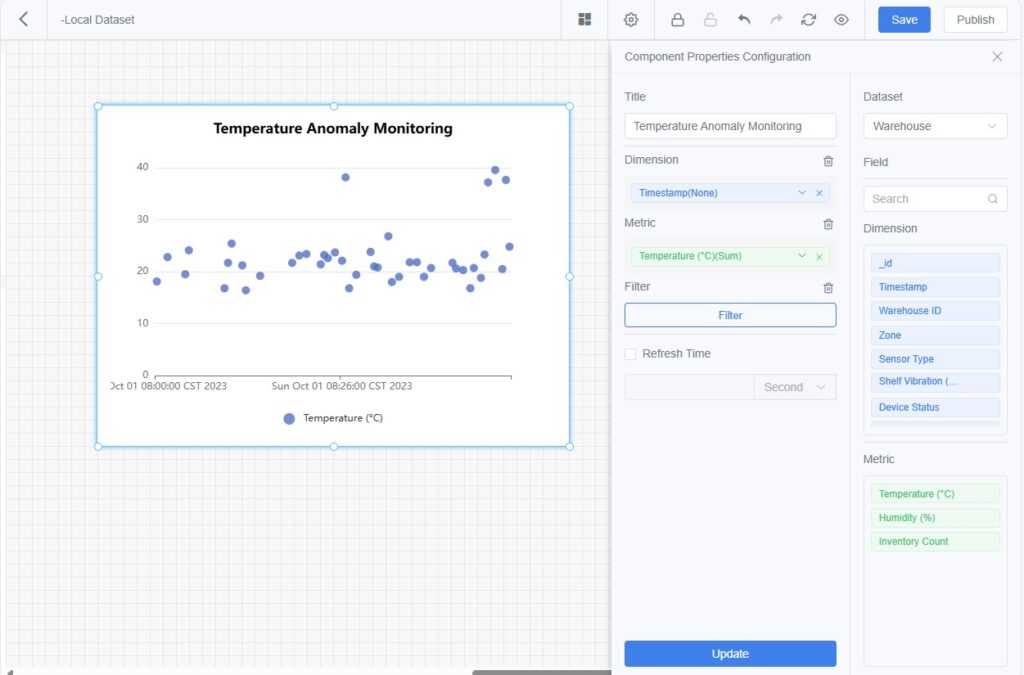
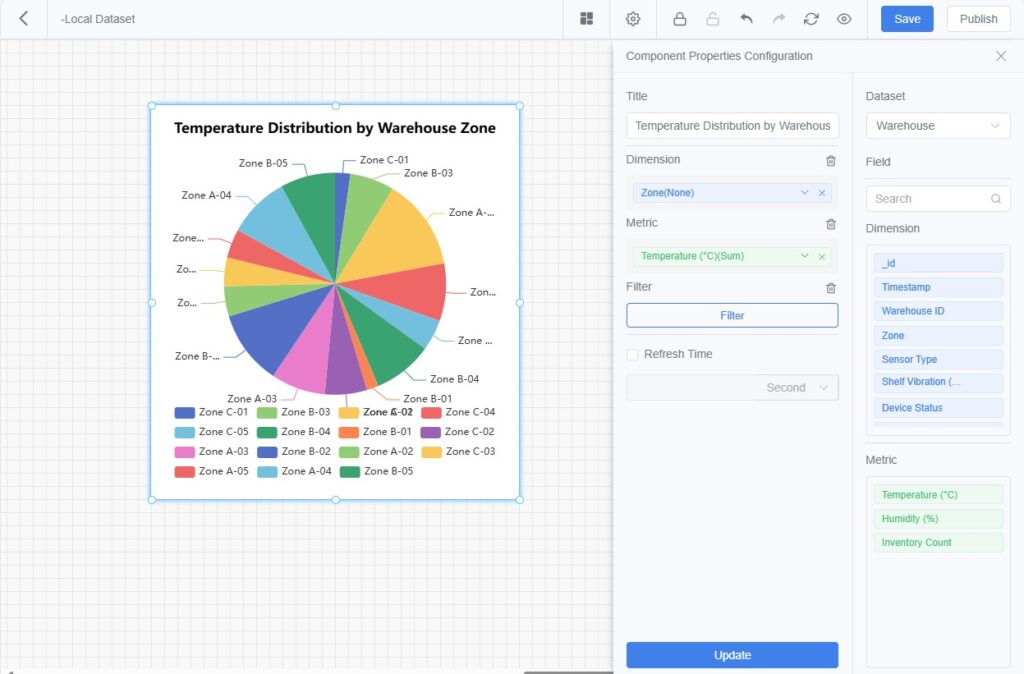
- Pie Chart:
Displays the proportional distribution of categories for ratio analysis.
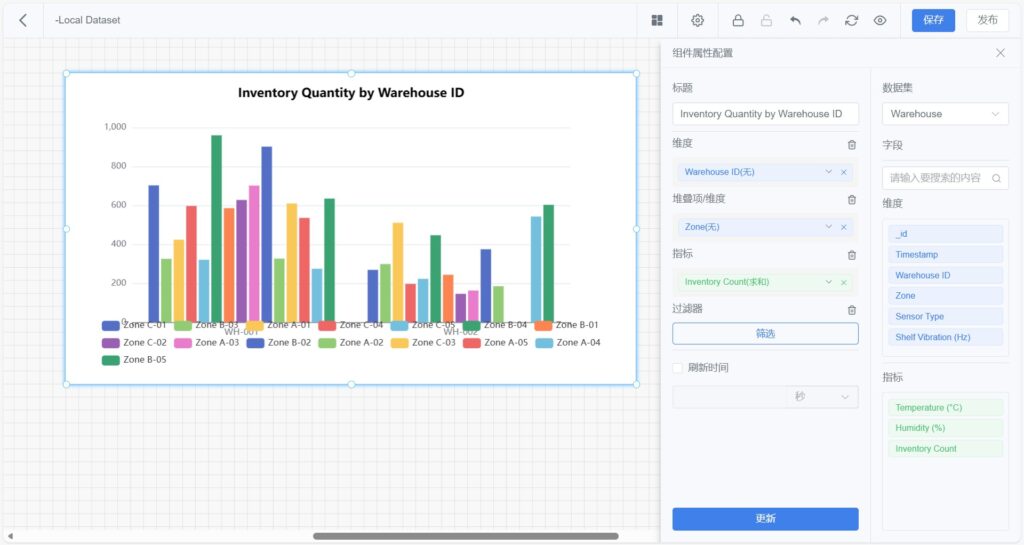
- Bar Chart:
Compares values across categories for classification or grouping analysis.
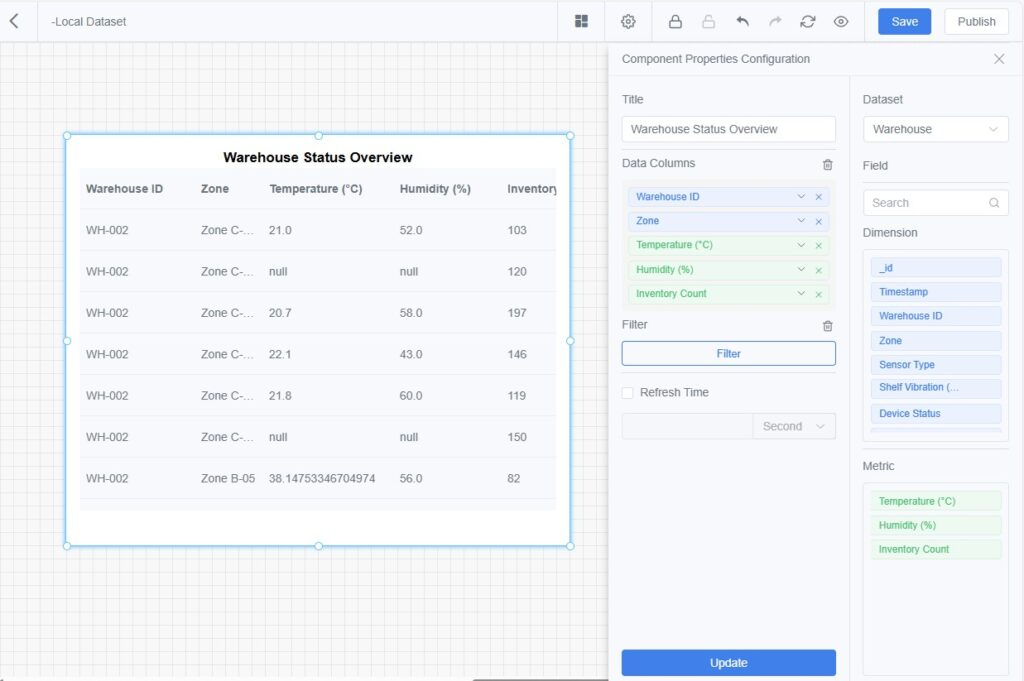
- Detail Table:
Displays both dimension and measure data in tabular form, supporting multi-column configuration and sorting.
Suitable for detailed data review.
Common Configuration Steps
- Add Component:
Click [Widget Menu] in the toolbar and choose a chart type to add to the dashboard. - Open Property Panel:
Double-click the component card to open the configuration panel on the right. - Set Title:
Enter a component title for easy identification. - Select Dataset:
Choose a dataset as the data source. - Configure Dimensions and Measures:
a) Drag dimensions/measures from the field list into their corresponding areas.
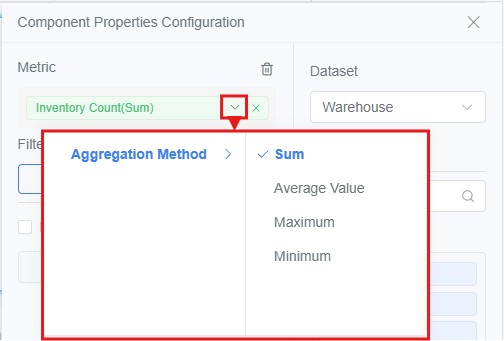
b) For dimensions, set the sort order (ascending, descending, or default). - Set Measure Aggregation:
Choose an aggregation method (Sum, Average, Max, Min, etc.).
- Add Filters (Optional):
Filter data by time, device ID, etc. - Set Refresh Interval (Optional):
Define the data refresh rate in seconds. - Update and Save:
Click [Update] to preview the chart, then [Save] when satisfied.
Text and Image Components
Text Component
Used to add descriptive text, titles, or annotations to dashboards for better explanation or business context.
- Supports custom text content.
- Displays a text editing toolbar for formatting (font size, color, background color, etc.).
- Allows position and size adjustment for layout alignment.
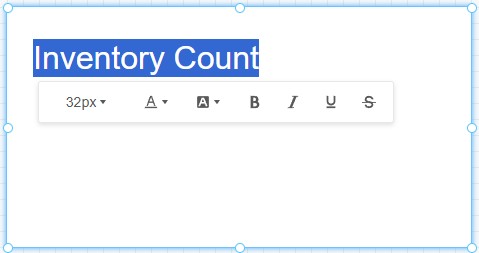
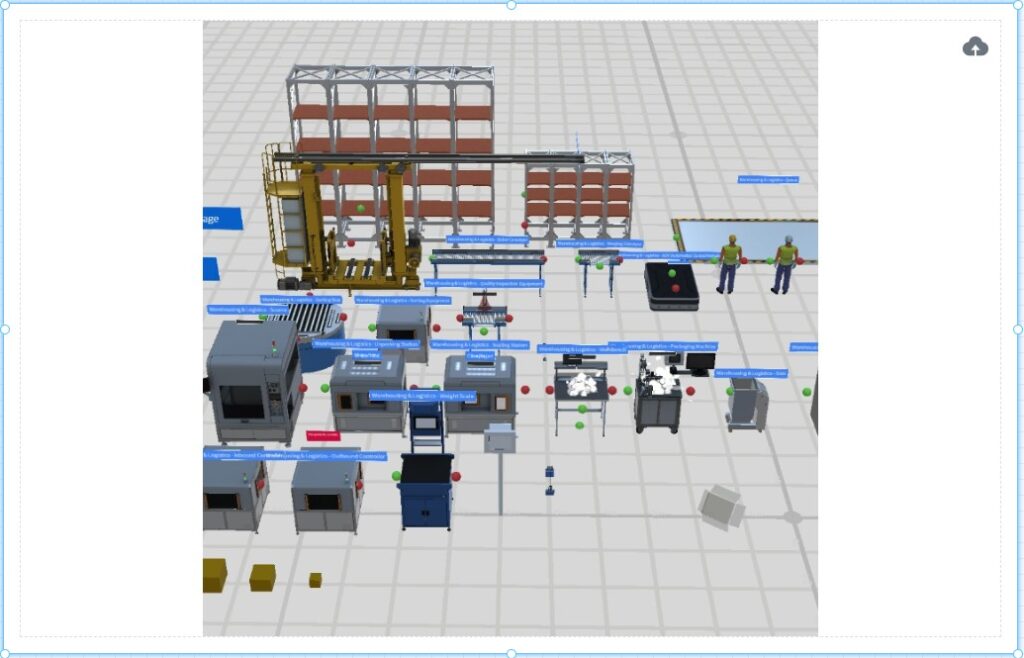
Image Component
Used to display static images (e.g., company logos, process diagrams, or illustrations) to enhance dashboard readability and visual appeal.
Data Exploration
Data Exploration is a core feature of the DFS platform for data analysis, feature extraction, and anomaly detection. Through a visual task-orchestration interface, users can build data processing pipelines, configure exploration methods and alert rules, and publish these exploration flows as reusable templates—enabling automated analysis and monitoring for subsequent datasets with the same structure and source.
After an exploration task is executed, the system generates a new exploration dataset that can be used for further analysis and validation, dashboard visualization, or business decision-making. When alert rules are configured, the system automatically identifies anomalies during template execution and generates alert events, forming a continuously running monitoring loop.
Key Concepts
- Exploration Dataset: The result dataset generated after running an exploration task. It typically contains applied processing logic and derived features.
- Alert Rules: Definitions of conditions used to detect data anomalies, including threshold checks, trend changes, or combinations of multiple criteria.
When alert rules are enabled, the system automatically evaluates data during template execution. Once the preset conditions are met, an alert event is triggered, providing timely risk notifications.
Note: If no alert rules are configured, the system only performs data exploration without anomaly detection or alert generation. - Data Exploration Template: A predefined set of exploration logic and processing rules for reuse to improve efficiency.
- Homogeneous Data: Data originating from the same source or acquisition channel—such as the same device, sensor, interface, integration system, or simulated record generated from the same digital-twin scene—and sharing a consistent structure, field format, and semantic definition.
Data Exploration Editor
The Data Exploration Editor provides a visual interface for orchestrating data-processing workflows. It includes a toolbar, a node panel, a canvas area, and additional interactive utilities.

Toolbar
![]()
- Select Parameters: Choose source data by parameter tags and dataset tags.
- Run: Execute the current task and produce processed results.
- Save: Save the current task configuration.
- Publish: Publishes the data exploration template. For homogeneous datasets, the system will automatically execute the corresponding data analysis and alert detection logic.
Node Panel
The Node Panel provides rich nodes for data processing, analysis, model computation, and output. Arrange them freely according to your business needs and analytical logic.
- Preprocessing Method Nodes: Initial treatment of raw data to enable better downstream analysis.
- Linear Interpolation
- Function: Estimate missing values by assuming linear change between neighboring known points.
- Use Cases: Fill small gaps in time-series data to maintain continuity.
- Data Downsampling
- Function: Convert high-frequency data to lower frequency (e.g., aggregate to once per second).
- Use Cases: Simplify overly frequent data for easier analysis.
- Data Imputation – Temporal Resampling
- Function: Resample low-frequency data to higher frequency for mixed-frequency analysis.
- Use Cases: Align low-frequency data with high-frequency series.
- Custom Preprocessing
- Function: Define bespoke preprocessing logic.
- Use Cases: When standard methods don’t meet requirements.
- Feature Extraction Method Nodes: Extract important statistical features for modeling and analysis.
- Maximum, Quartiles (25/50/75%), Standard Deviation, Median, Mean, Variance, Minimum
- Custom Feature Extraction: Define feature rules tailored to your needs.
- Alert Rule Node: Defines the alert conditions triggered by data.
- Rule-Based Alerts: Continuously monitors data using predefined logic—such as threshold checks, range conditions, or multi-criteria combinations. When the data meets the configured alert conditions and matches the specified evaluation method (e.g., “all conditions met” or “any condition met”), the system automatically triggers an alert and generates the corresponding alert information.
- Calculation Nodes: Perform mathematical operations during processing—often used to build computed measures or new derived fields.
- Output Nodes: Export or forward processed results.
- Preprocessing Output Node: Output preprocessed data for downstream analysis.
- Linear Interpolation
Canvas (Workflow Area)
Use the canvas to configure the data exploration workflow:
- Add Nodes: Drag nodes from the left panel onto the canvas to build the task skeleton.
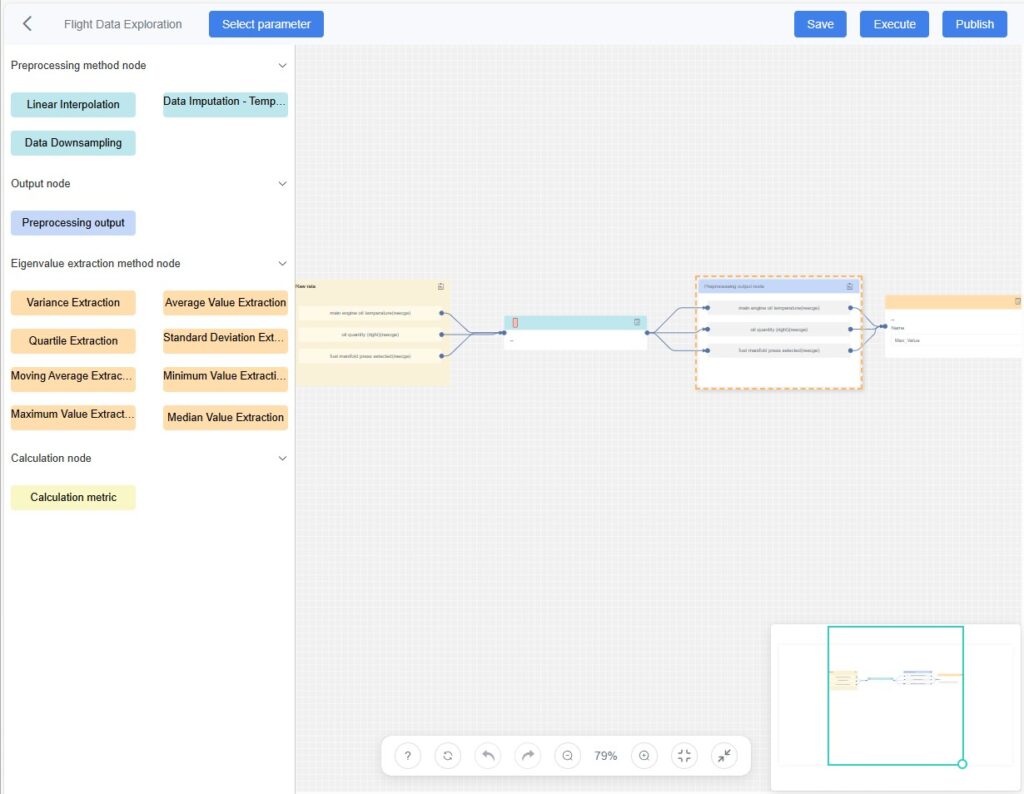
- Connect Nodes: Drag connectors from a node’s output to another node’s input. Arrows indicate the processing sequence.
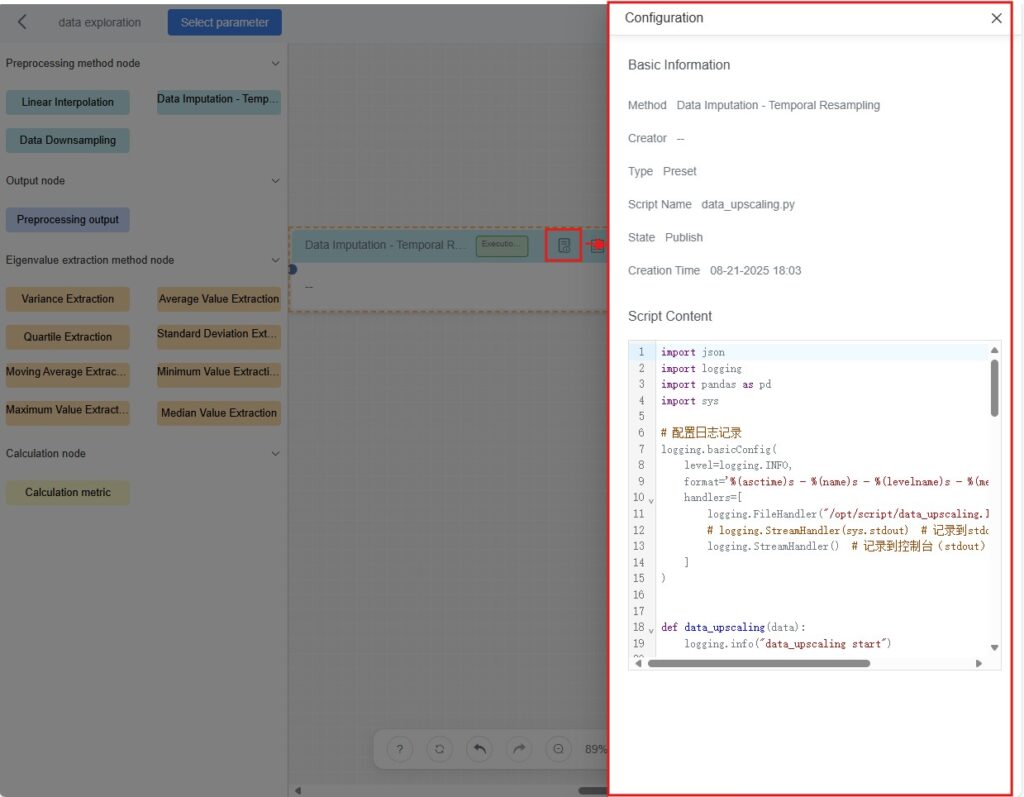
- View Node Details:
- Basic Info: Method name, type, creator, status, etc.
- Script Content: Code or scripts associated with the node.
- Inspect Node Outputs: After running the task, view each node’s processed data directly on the canvas to understand results.
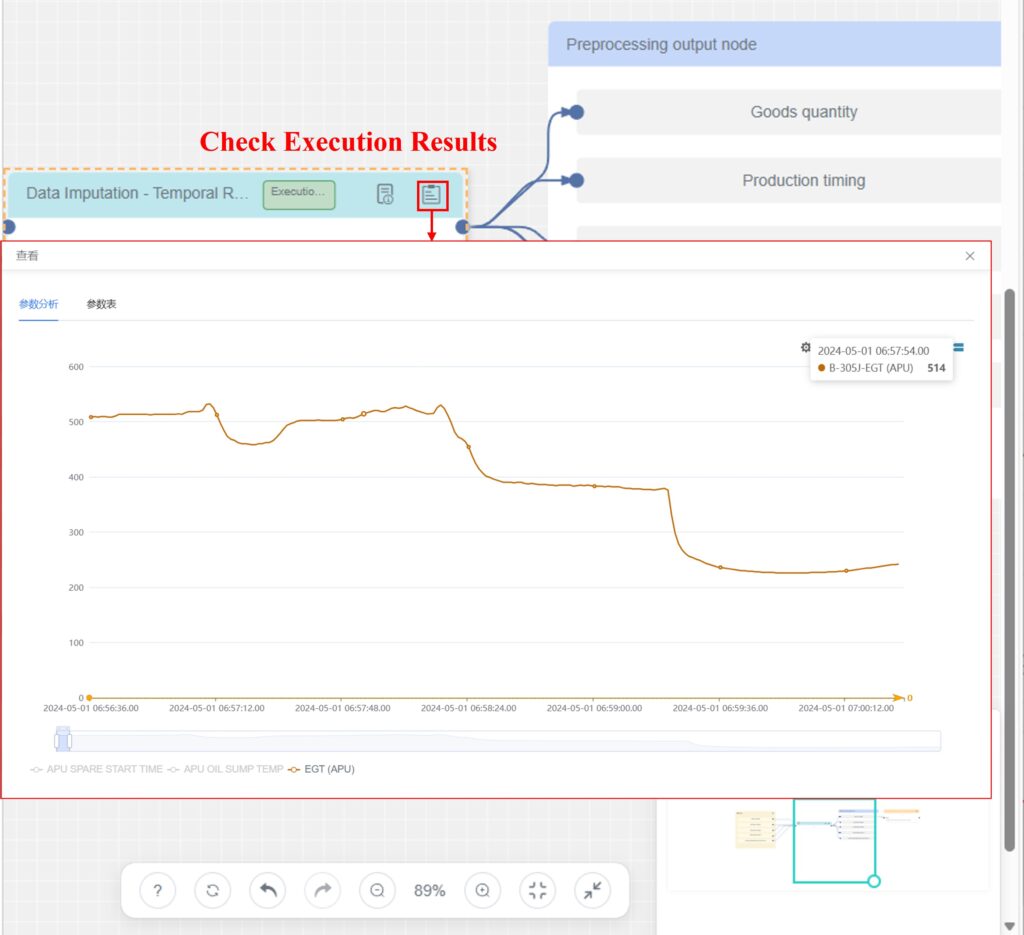
Interaction Menu

- Help
 : Hover the cursor over the Help icon to open the “Shortcut Keys” pop-up, then click it to see all available keyboard shortcuts.
 - Clear Canvas
 : Remove all nodes and connections to reset to a blank state.
 - Undo
 / Redo
  : Revert or reapply recent operations.
 - Zoom Out
 / Zoom In
  : Adjust the canvas scale for overview or detail.
 - Reset : Restore the default canvas view (size and scale).
- Fit : Auto-fit the current content to the viewport.
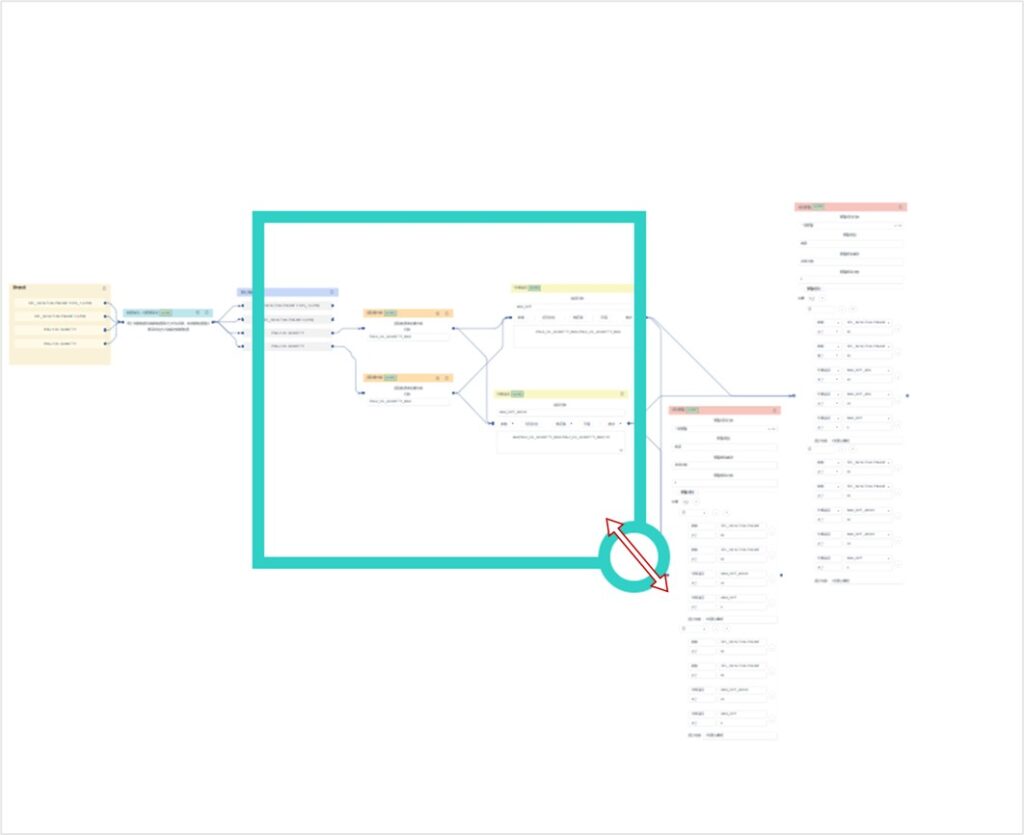
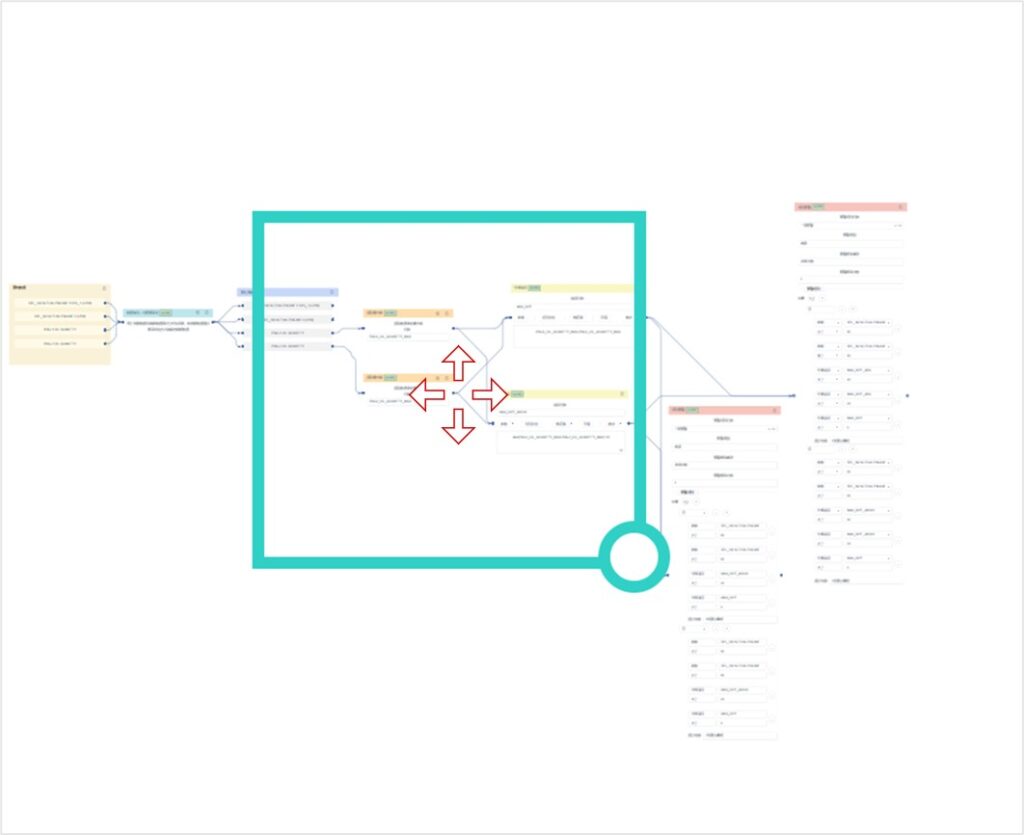
Mini-Map
The mini-map in the bottom-right corner provides quick navigation and view control on complex workflows.
- Resize Viewport: Drag the circular handle at the viewport’s lower-right corner to enlarge or shrink the visible area.
- Move Viewport: Drag the green viewport or click empty areas to reposition and focus on different canvas regions.
Data Exploration Workflow
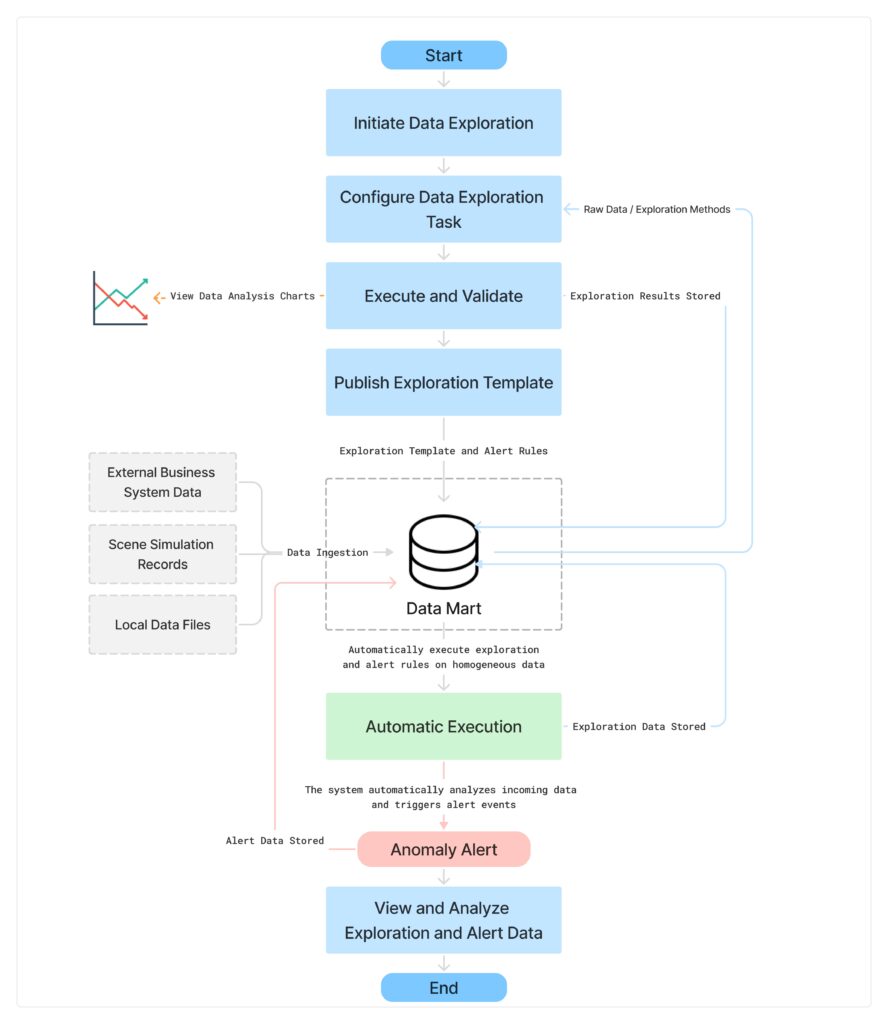
The diagram above illustrates the complete lifecycle of a data exploration task—from configuration and execution to template publishing, automated processing, and result storage. The workflow supports the configuration of alert rules. If alerts are not enabled, the system executes only the data-processing logic without performing anomaly detection.
The data exploration workflow applies to multiple data sources, including:
- Data uploaded from external business systems connected through the integration platform
- Simulated records generated and uploaded by FactVerse Designer
- .csv files manually uploaded by users via the general dataset interface
After an exploration template is published, the system automatically applies the configured exploration logic to subsequent homogeneous datasets ingested into the platform. When the rule conditions are met, alerts are triggered, enabling detailed inspection and traceability analysis.
Initiating Data Exploration
You can initiate a data exploration task in two ways:
Method 1: Create a new task on the Data Exploration page
Steps
- On the Data Exploration page, click [New].

- In the pop-up window, fill in the task information.
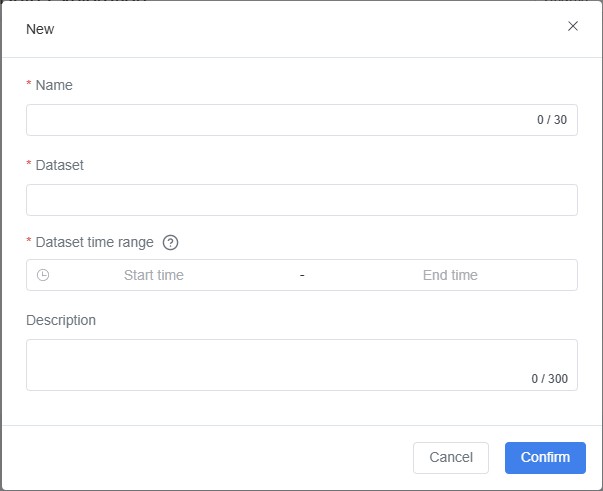
- Name (Required): Enter a name for the exploration task.
- Dataset (Required): Select the dataset to analyze.
- Dataset Time Range (Required): Choose the analysis span via start and end times.
- Description (Optional): Provide context or purpose for the task.
- Click [Confirm] to open the Data Exploration Editor for task configuration.
Method 2: Initiate a task directly from the General Dataset page
Steps
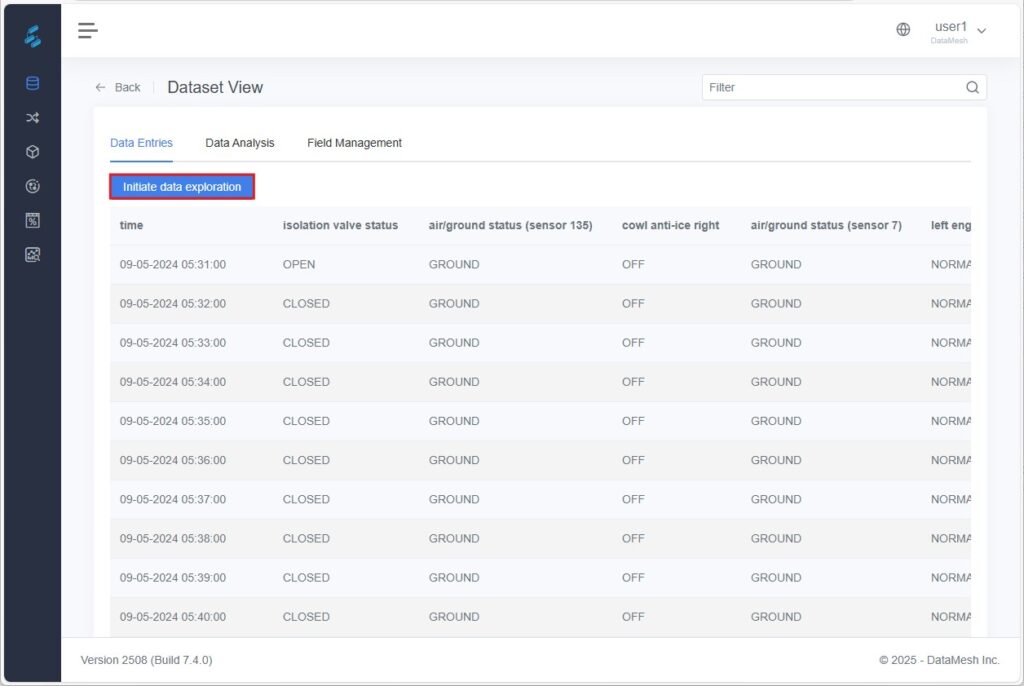
- On the General Dataset page, select a target dataset, then click the dataset name or Details to open the Data Viewing
- In the Data Table tab, click [Start Data Exploration].
- In the pop-up window, enter:
- Name (Required): Exploration task name.
- Description (Optional): Task background or objective.
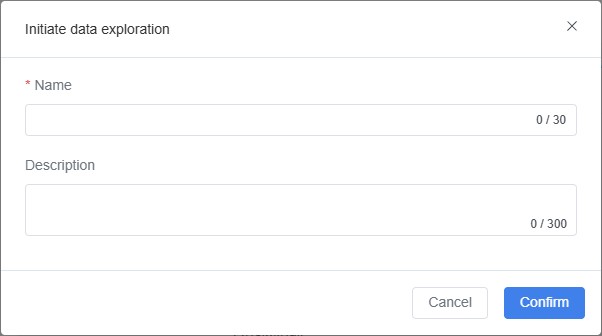
- Click [Confirm] to open the Data Exploration Editor.
Configuring a Data Exploration Task
In the task configuration canvas, you can construct a data-processing workflow by dragging and connecting nodes, and configure alert rules as needed.
Steps
- Open the Data Exploration Editor:
- After creating a new data exploration task, the system automatically opens the editor panel.
- You can also enter the editor by clicking the task name or Orchestration Rules in the Data Exploration list.

- Select Raw Data:
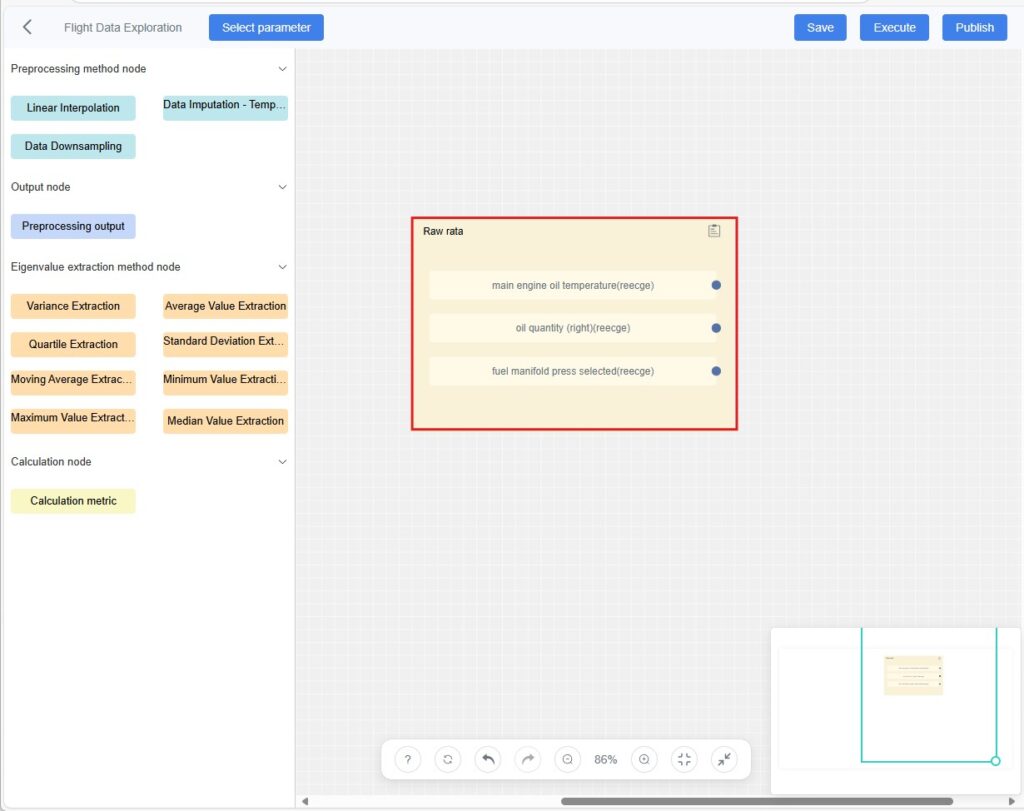
a) Click [Select Parameters] on the toolbar to open the data selection window.
b) In the pop-up window, filter the required data via:
- Parameters: Choose parameters from the dataset.
- Parameter Rules: Narrow the scope by setting value ranges to quickly locate target data.
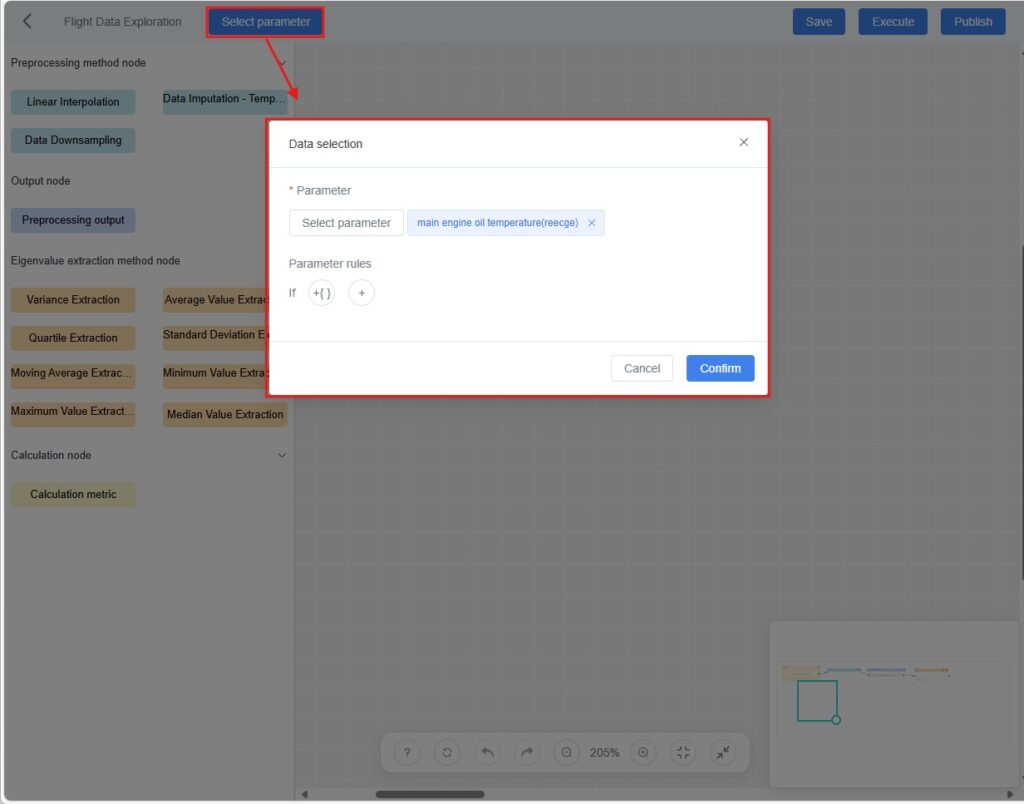
c) Click [Confirm]. The system adds a Raw Data node to the canvas.
- Configure the Data Processing Workflow
- Drag processing nodes onto the canvas and connect them to define the data-processing logic.
- If specific algorithms are required, you can create custom methods in the Exploration Method Management module beforehand.
- Configure Alert Rules (Optional)
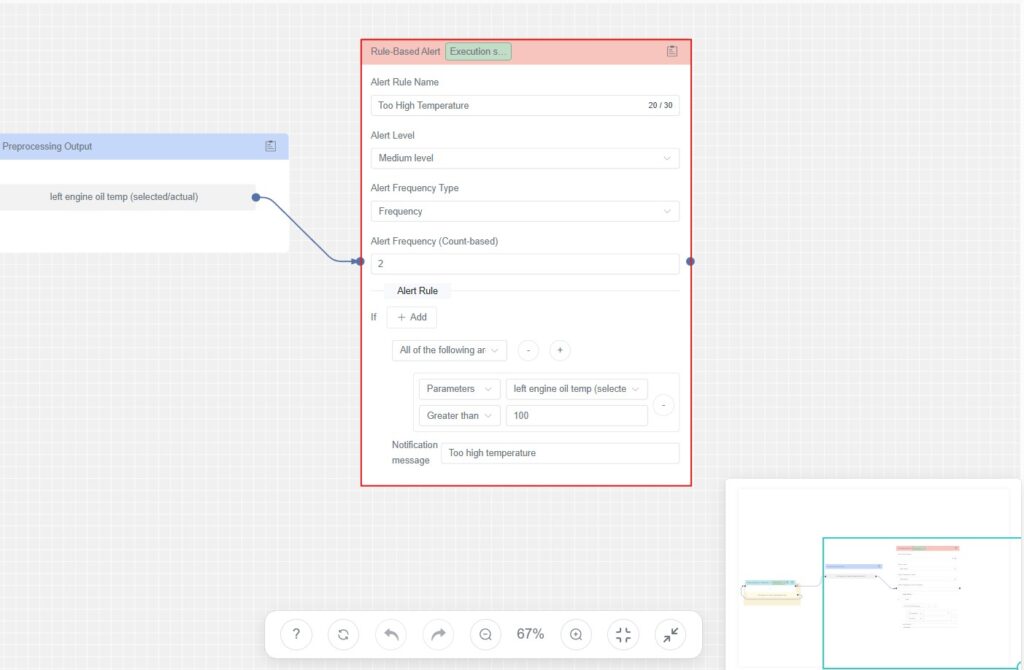
- Drag the Alert Rule node onto the canvas and connect it to the upstream node.
- Configure rule conditions. See the next section, Alert Rule Configuration, for details.
- Save the Configuration: Click Save to store the current data exploration setup.
Alert Rule Configuration
In the exploration workflow, you can configure alert rules for key parameters, feature values, or computed metrics. The system automatically detects anomalies based on these rules and generates corresponding alert records.
Supported Features
- Multiple condition groups: Add and evaluate multiple rule conditions.
- Configurable logic mode: Choose between “All conditions met” or “Any condition met.”
- Flexible trigger mechanisms: Supports various alert trigger frequencies.
- Custom alert messages: Define personalized messages to help identify issues quickly.
Configuration Item Description
Configuration Item | Description |
Alert Rule Name | Required. Used to identify this alert rule. |
Alert Level | Optional. Choose from High / Medium / Low. |
Alert Frequency Type | Defines how and when alerts are triggered:
|
Logic Mode | Logic for evaluating multiple conditions:
|
Condition Type | Defines the data used for evaluation. Options include:
|
Operator | Comparison method: >, ≥, <, ≤, =, ≠, Include, Not include. |
Threshold | The comparison value used to determine anomalies. For example: Temperature > 70°C |
Notification Message | The message shown when an alert is triggered. It should be clear and concise, e.g., “Temperature too high — please check the device.” |
Execution and Validation
After completing the task configuration, you can verify the correctness of the exploration workflow and the resulting data through the following actions:
- Run the Task:
Click [Execute] (top-right of the canvas). The system executes the node logic defined in the workflow (e.g., cleaning, feature extraction, model computation) and generates analysis results.
Results are automatically saved to the General Dataset area for later viewing and analysis. - Validate Results:
Click the View button on a processing node to open charts and tables of that node’s output.
- Examine trends, patterns, and anomalies to verify expectations.
- Compare chart and table outputs to check whether calculations and analysis meet expectations.
- Cross-validate against raw data, external sources, or known standards to assess accuracy.
- Refine the Workflow:
If results are not satisfactory, adjust node configurations and rerun the task to iteratively improve the pipeline.
Publishing the Data Exploration Template
Once the task configuration is verified, click Publish to save the current workflow as a reusable template.
- After a template is published, the system automatically applies the exploration logic to subsequent homogeneous datasets imported into the platform.
- If alert rules are configured, the system will automatically trigger alerts when anomalies are detected and record them accordingly.
Viewing and Analyzing Alert Information
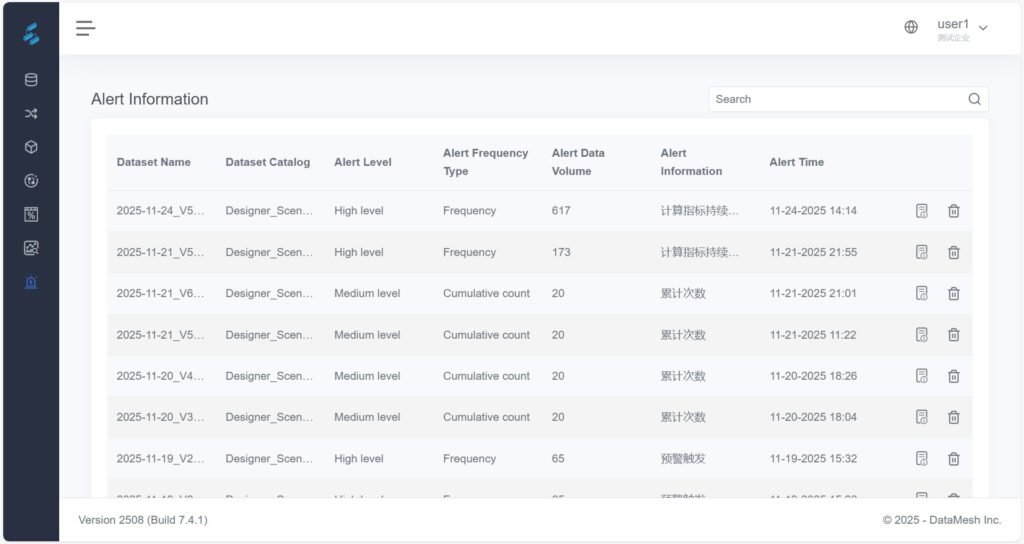
For triggered alerts, you can review detailed alert information in the system and trace back to the associated exploration workflow to understand the cause of the anomaly.
Steps
- Locate Alert Records
On the Alert Information page, use filtering options to find the desired alert.
- View Details
Click a record to enter the Alert Details page, where you can view:
- Basic information such as alert time, level, and message
- The configured rule conditions and trigger logic
- Traceability Analysis
a) Click the View Alert Data icon ![]() at the bottom-right corner to view the detailed data that triggered the alert.
at the bottom-right corner to view the detailed data that triggered the alert.
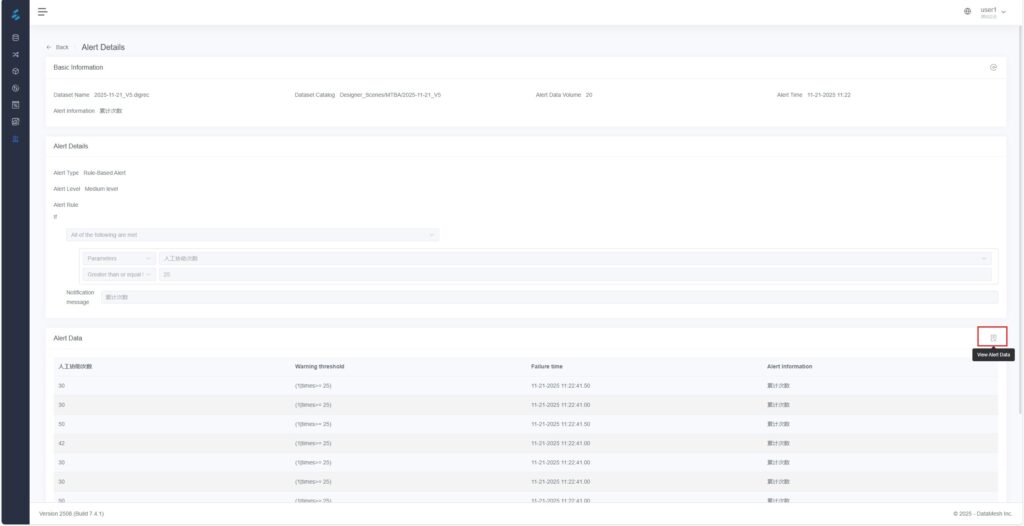
b) Click the Alert Traceability icon ![]() at the top-right corner to open the associated Data Exploration task panel.
at the top-right corner to open the associated Data Exploration task panel.
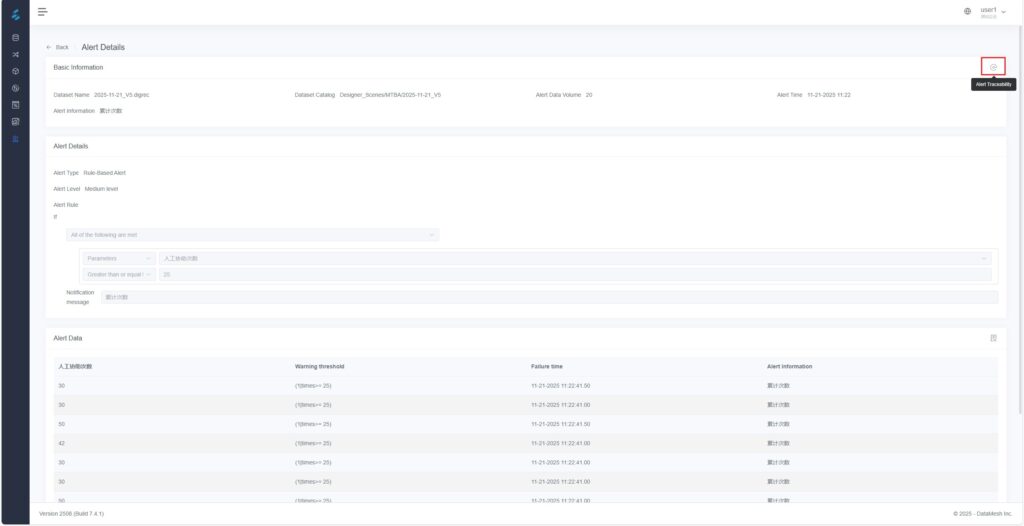
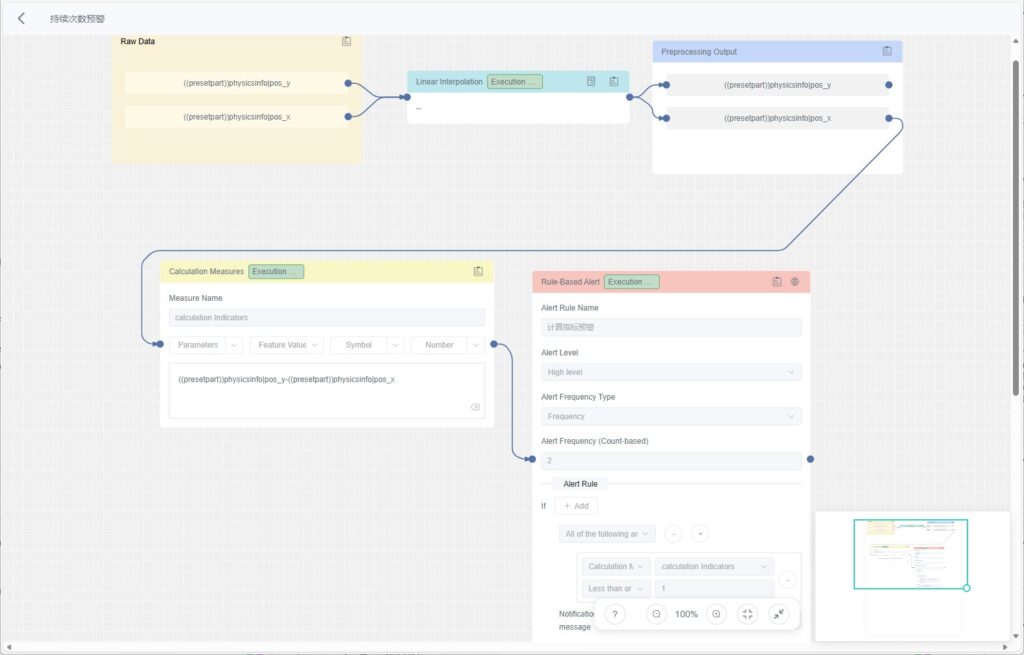
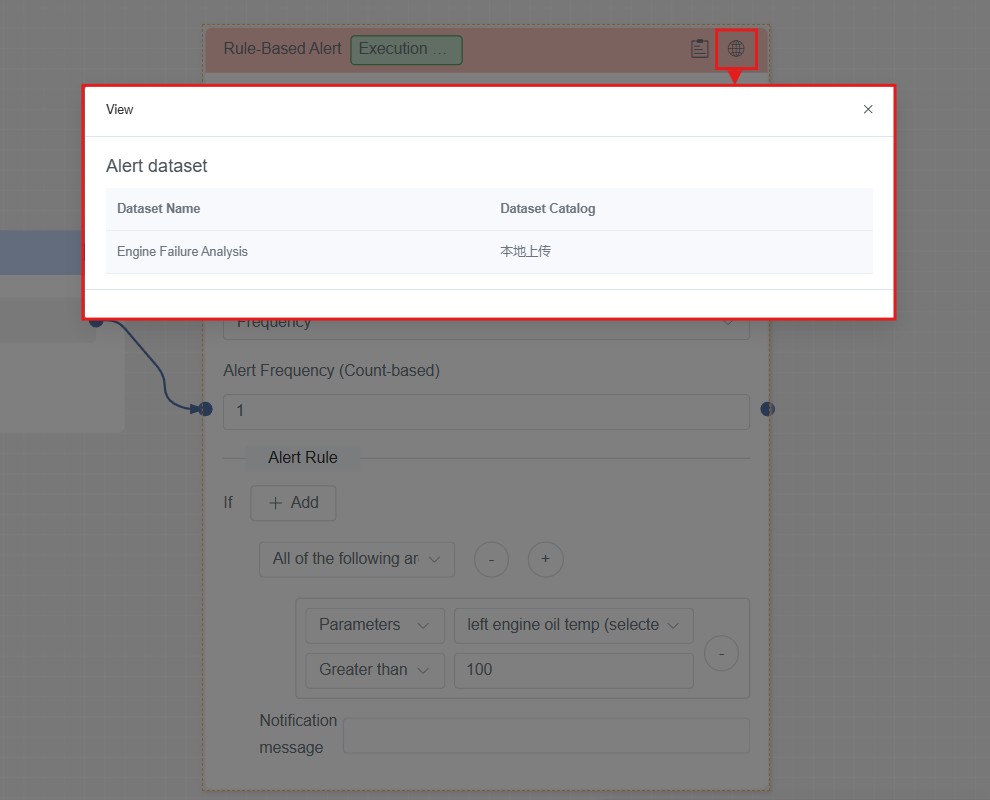
c) On the canvas, locate the rule-based alert node that triggered the alert. Click the View Data Details icon ![]() in the upper right corner of the node to open the chart analysis page and review the trend and variation of the anomalous data.
in the upper right corner of the node to open the chart analysis page and review the trend and variation of the anomalous data.
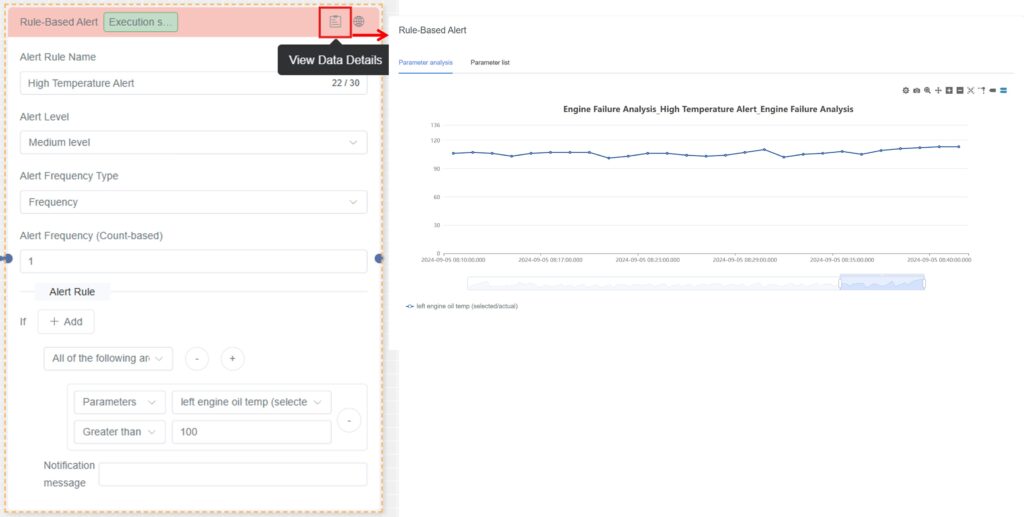
d) Click the View Alert Information icon ![]() to open the original dataset associated with the alert rule.
to open the original dataset associated with the alert rule.
Exploration Method Management
This section provides a detailed introduction on how to flexibly extend the platform’s data-processing capabilities by defining custom preprocessing and feature extraction method models.
Preprocessing Method Management
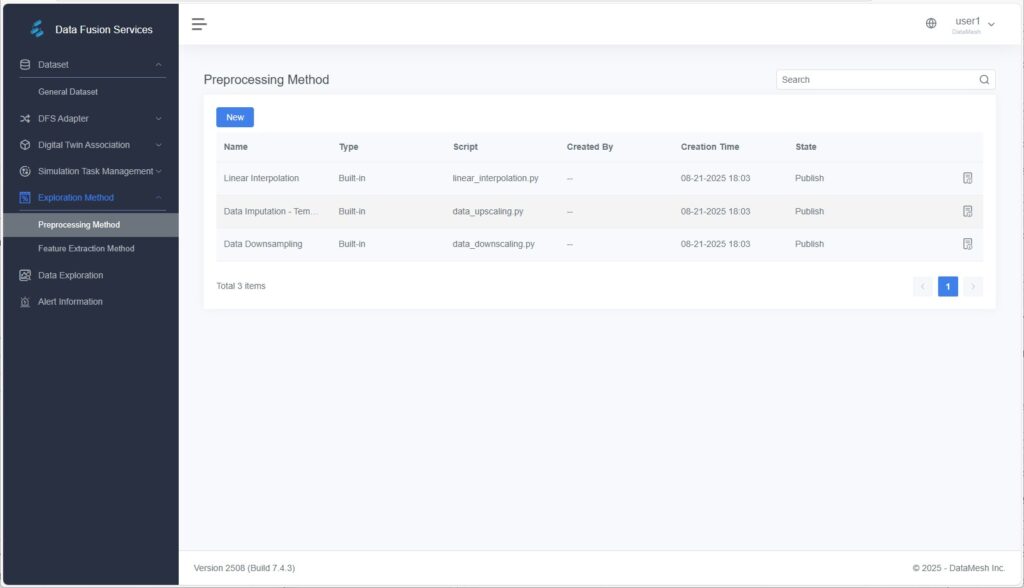
The Preprocessing Method Management page displays all available preprocessing methods in the system, including both built-in and user-defined methods.
Functions
- View Preprocessing Methods: Displays all built-in and user-defined methods, including method names, descriptions, and script contents.
- Add Preprocessing Method: Allows users to upload or directly input Python scripts to create custom preprocessing methods.
- Delete Preprocessing Method: Enables removal of methods that are no longer needed.
Built-in Methods
The system provides several commonly used preprocessing methods that can be directly applied to data processing:
- Linear Interpolation: Fills missing values in continuous data using linear estimation.
- Downsampling: Reduces data frequency to match analysis requirements.
- Time Resampling and Filling: Resamples data based on time to resolve inconsistent time intervals.
Custom Methods
Users can write Python scripts to define personalized preprocessing methods.
- Supports uploading script files or entering scripts directly in the system.
- Custom methods allow flexible extension of preprocessing capabilities for complex data scenarios.
Creating a Custom Preprocessing Method
Steps
- Open the Add Page: On the Preprocessing Method page, click [New].
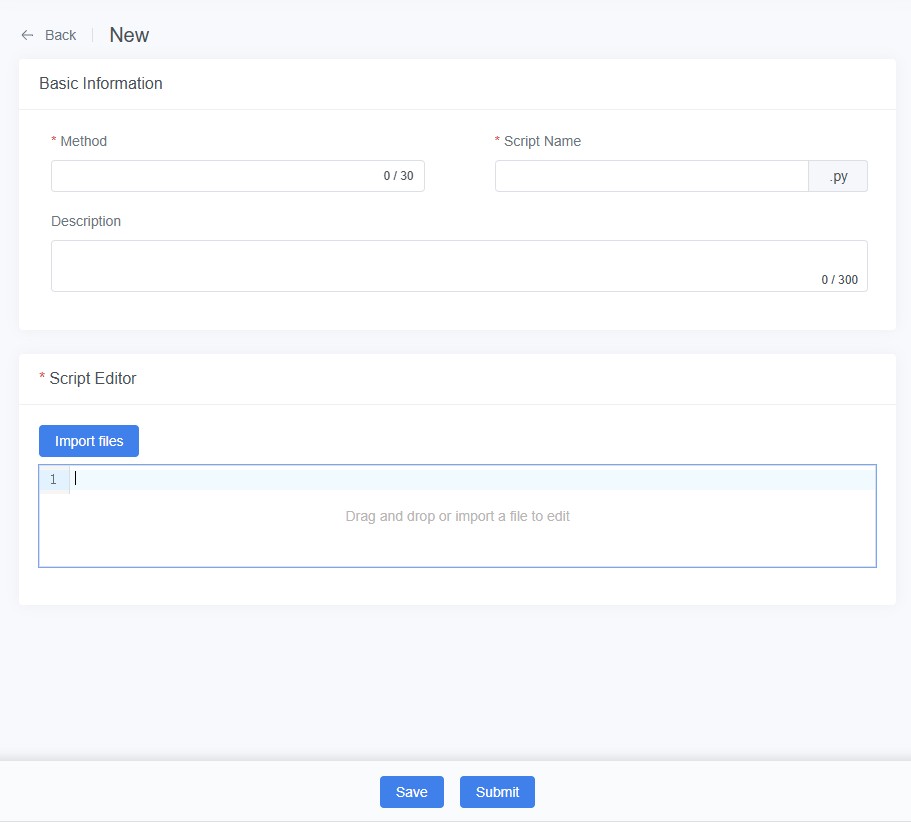
- Enter Method Information:
- Method (Required): Specify the method name.
- Script Name (Required): Provide the filename of the preprocessing script.
- Description (Optional): Add notes about purpose and logic.
- Upload Script File: Upload via drag-and-drop or file import.
- Save Method: Click [Save] to store the method as a draft. You can test it later within a data exploration task.
- Submit for Release: After validation, click [Submit] to publish the method for system-wide use.
Feature Extraction Method Management
The Feature Extraction Method page allows users to view and define custom feature extraction methods.
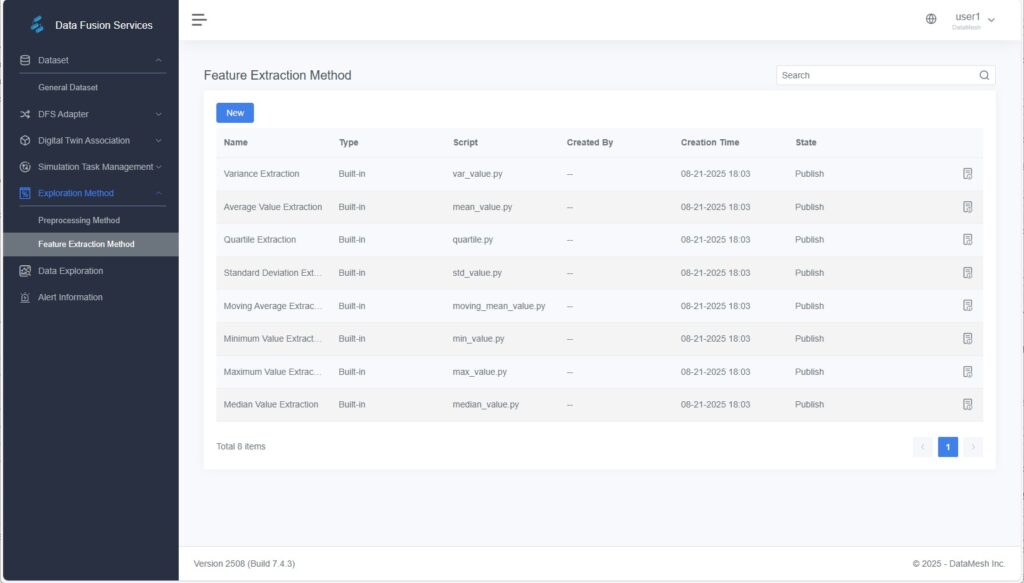
Built-in Methods
- Extract Maximum
- Extract Quartiles
- Extract Standard Deviation
- Extract Median
- Extract Mean
- Extract Variance
- Extract Minimum
Custom Methods
- Python Scripts: Users can write and upload Python scripts to define new feature extraction methods that meet specific analytical needs.
Creating a Custom Feature Extraction Method
Steps
- Open the Add Page: On the Feature Extraction Method page, click [New].
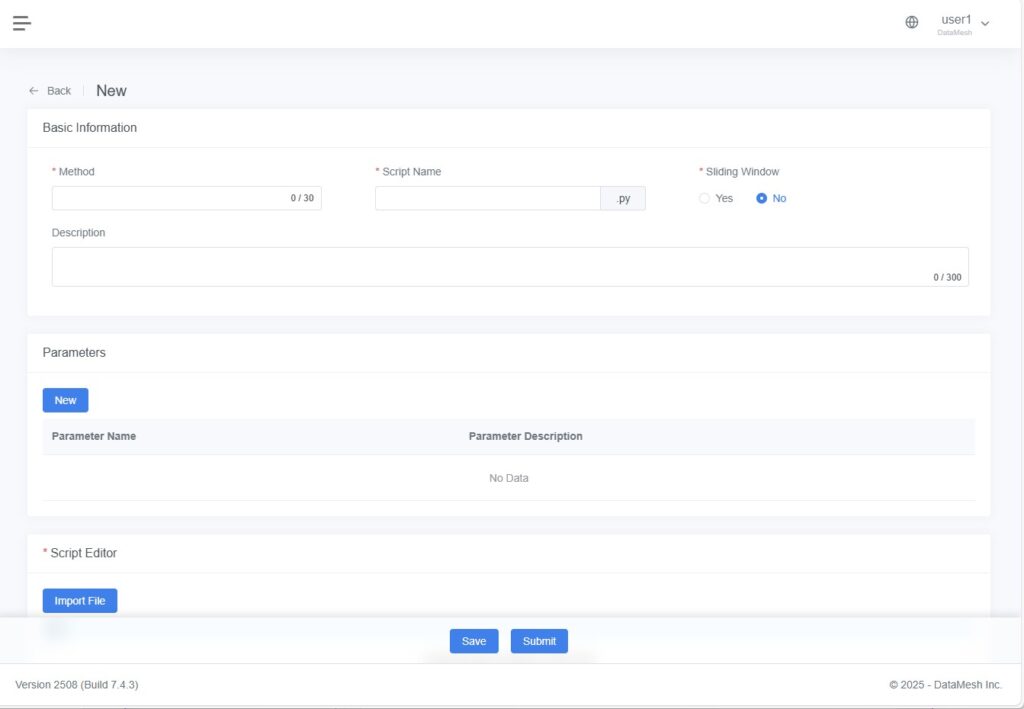
- Enter Method Information:
- Method (Required): Specify a name for the feature extraction method.
- Script Name (Required): Specify the name of the Python script file.
- Description (Optional): Provide additional information about the method logic.
- Sliding Window: Select “Yes” to enable sliding window processing, allowing data to be divided into segments (based on step size) and multiple feature sets to be generated.
- (Optional) Configure Dynamic Parameters:
Add adjustable parameters that control feature extraction behavior.
Example: Add a “Window Size” parameter, allowing users to specify its value when executing exploration tasks for flexible control of feature extraction. - Upload or Edit Script: Upload a Python script file by drag-and-drop, or enter Python code directly into the editor.
- Save Method: Click [Save] to store the method as a draft for validation in exploration tasks.
- Submit for Release: Once verified, click [Submit] to change its status to Published, making it available for use in exploration workflows.