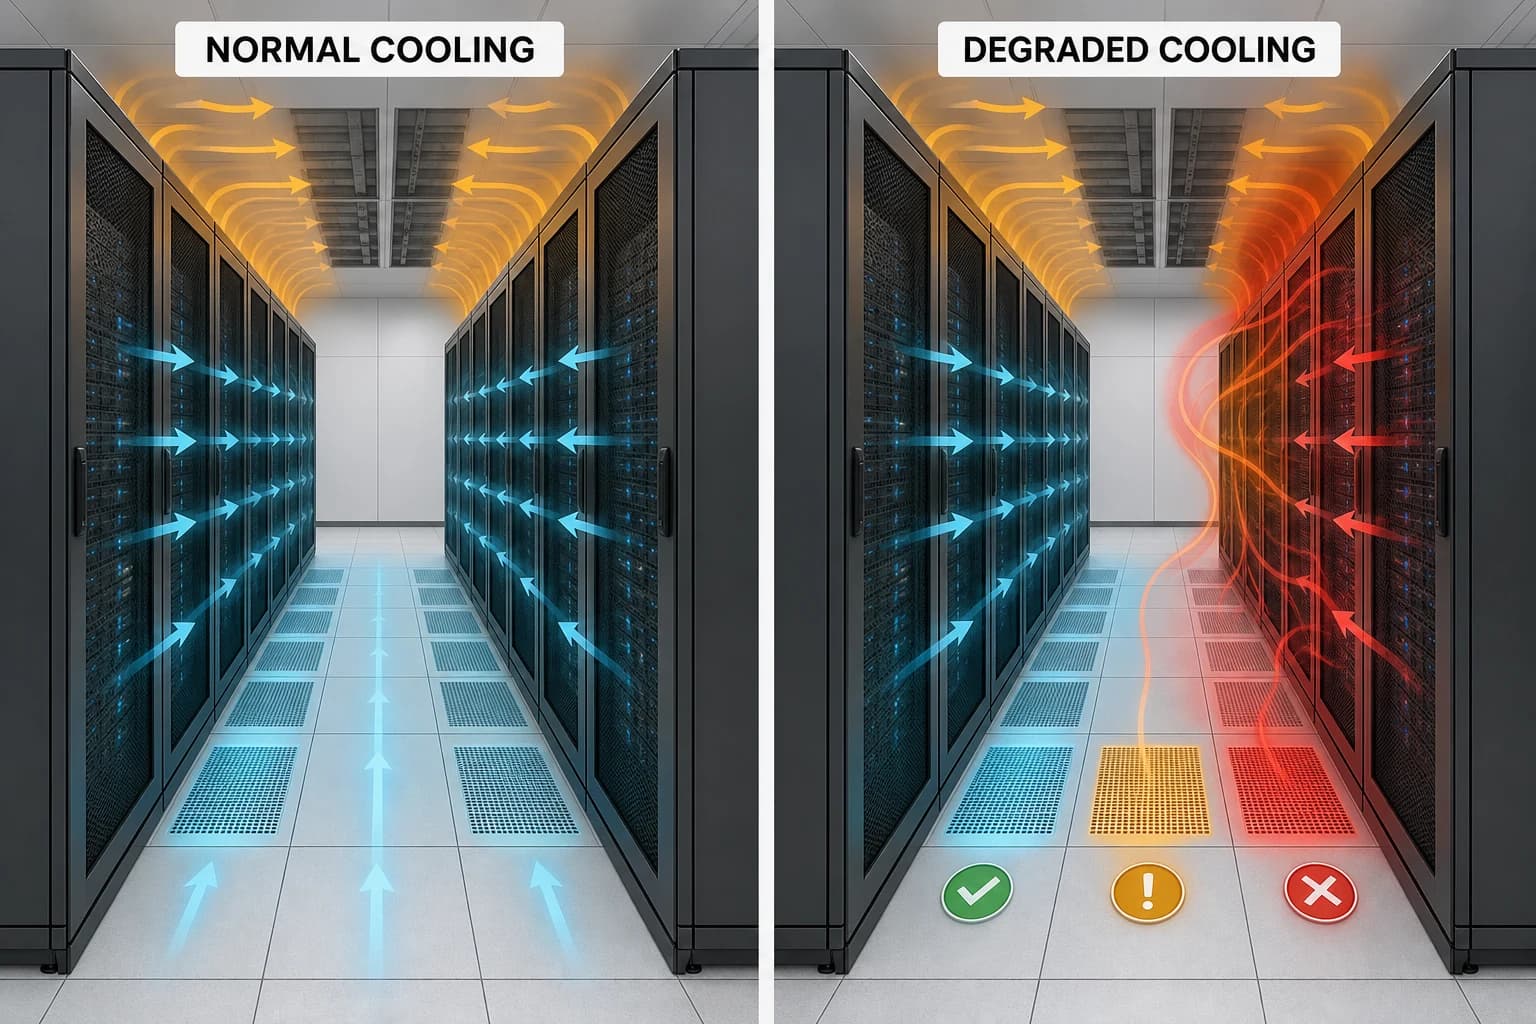
Resilience planning begins before the alarm
Cooling resilience is tested when an operating state changes faster than a team can assemble context. A cooling unit may lose capacity, a fan or pump may degrade, a valve or damper may remain in an unexpected position, containment may be compromised, or planned maintenance may reduce available redundancy. The consequence depends on the active information technology load, airflow paths, thermal mass, equipment distribution, controls, and response timing.
A scenario study lets facility teams review those dependencies before a live event. It compares defined operating states, shows which areas may be affected first, and gives engineers evidence for monitoring priorities, maintenance planning, contingency procedures, and capacity decisions.
The result is a decision aid for qualified review. Authorized facility teams remain responsible for operating procedures, controls, safety limits, and live intervention.
Build a scenario family around credible operating states
A single failure image gives limited insight. A scenario family shows how the result changes across equipment states, loads, and response assumptions.
| Scenario state | Example definition | Buyer question |
|---|---|---|
| Normal | Intended cooling equipment available, representative load, verified controls, and baseline containment | What is the current thermal distribution and operating margin? |
| Degraded | Reduced fan or pump performance, partial cooling capacity, leakage, fouling, or constrained airflow | Which racks and zones lose margin first? |
| Unavailable | One selected cooling path or component removed from service under a defined load and control state | How quickly do affected locations approach an agreed limit? |
| Recovery | Equipment restoration, load transition, temporary airflow measure, or approved operating response | How does the thermal field recover, and which areas remain sensitive? |
Each state should identify the event boundary, affected equipment, starting condition, active controls, information technology load, time horizon, and response assumption. This creates a reviewable scenario specification and prevents different teams from interpreting “cooling failure” in different ways.
Connect the scenario with current facility evidence
A useful cooling-resilience study combines spatial, operational, and governance evidence.
Facility and cooling model
- room, aisle, rack, containment, floor, ceiling, duct, grille, and opening geometry
- cooling-unit location, rated and observed performance, airflow paths, and supply and return arrangement
- rack population, equipment airflow direction, representative load, and load distribution
- power and cooling dependencies relevant to the selected disturbance
- control states, setpoints, sequencing, redundancy mode, and maintenance condition
Measurements and operating history
- rack-inlet and room environmental measurements with identity, location, time, and quality context
- supply, return, flow, pressure, fan, pump, valve, and cooling-unit state where available
- alarms, excursions, inspections, maintenance records, and previous event timelines
- stable periods, load transitions, maintenance windows, and degraded operating periods suitable for comparison
Decision and acceptance context
- customer-approved equipment envelope and facility operating limits
- selected review thresholds and the source of each threshold
- required time horizon and temporal resolution
- evidence level, calibration target, acceptance criteria, and engineering owner
Data Fusion Services can align telemetry, asset identities, events, alarms, and maintenance history. DataMesh FactVerse maintains the room, rack, cooling, sensor, and dependency context. Together, they create a baseline that can support both live operational review and project-enabled scenario analysis.
Compare normal and degraded behavior visibly
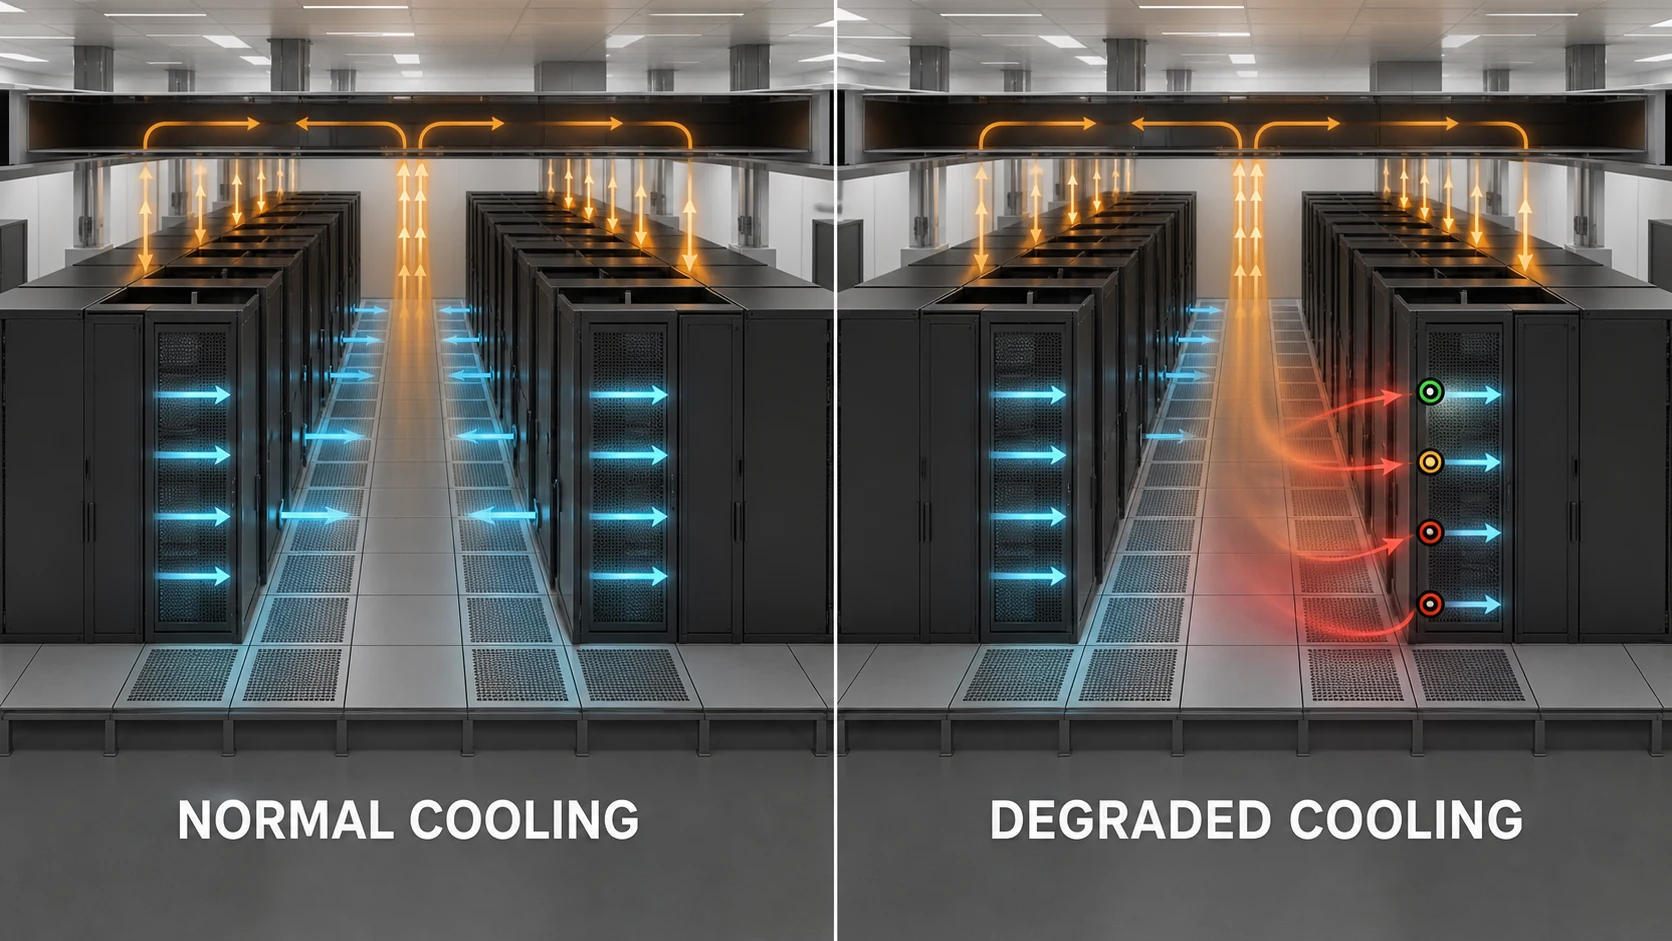
A normal-versus-degraded comparison helps reviewers see where airflow distribution changes, which inlet locations are affected, and where margin narrows.
The comparison should preserve a common geometry, load basis, result scale, and review threshold. Changes between states then remain attributable to the selected scenario inputs.
Useful comparison views include:
- airflow direction and recirculation around affected rows
- rack-inlet temperature by location and height
- thermal margin by rack, aisle, room, or equipment class
- rate of temperature rise after the disturbance begins
- time to an agreed alert or engineering-review threshold
- affected zone growth over the selected time horizon
- sensitivity to load, initial condition, equipment performance, and response timing
- recovery behavior after the approved response or equipment restoration
Read time-to-limit as conditional evidence
Time-to-limit can help teams understand how quickly a reviewed location approaches an agreed threshold after a defined disturbance. It should be reported with the conditions that give it meaning:
time-to-limit = time when the agreed threshold is reached - scenario start time
The evidence package should state:
- the initial thermal field and operating state
- the selected cooling change and event timing
- the information technology load and load behavior
- the threshold source, location, and measurement definition
- the controls or operator responses represented
- model time step, convergence checks, and numerical settings relevant to the result
- calibration residuals, uncertainty, and sensitivity to influential assumptions
A single time value can hide important variation. Buyers should review ranges across plausible initial conditions, loads, cooling performance, and response timing. The most useful output may be the earliest credible threshold approach, the racks that consistently lead the response, and the assumptions that change the result most.
Match the evidence level to the resilience decision
| Evidence level | What it can support | Review expectation |
|---|---|---|
| Exploratory | Identify likely affected areas, compare broad scenario behavior, and plan measurements | Reviewed assumptions, geometry, major inputs, sensitivity, and visible limitations |
| Benchmarked | Qualify the analysis workflow against controlled or recognized reference behavior | Repeatable setup, reference comparison, solver checks, and documented acceptance |
| Measured-data calibrated | Compare site-specific scenarios within a documented operating range | Representative measurements, residuals by location and state, parameter record, and validation evidence |
| Scenario-specific validated | Support a defined higher-consequence planning decision under relevant conditions | Independent evidence, robustness review, uncertainty, qualified approval, and revalidation triggers |
Calibration should follow the decision metric. A time-to-limit claim needs time-dependent measurements and transition evidence. A rack-inlet margin claim needs measurements at relevant rack locations and loads. A recovery claim needs suitable evidence from restoration, load transition, or a controlled test condition.
The calibration and simulation confidence guide provides a fuller evidence framework. The scenario ensemble guide explains how to review ranges, interactions, and conservative decision cases.
Translate scenario evidence into response priorities
A resilience study becomes operationally useful when its findings are tied to locations, assets, owners, and approved actions.
The review can help teams prioritize:
- rack-inlet locations for closer live monitoring
- sensors that need verification, relocation, or added coverage
- cooling assets and dependencies for inspection or maintenance
- containment, leakage, obstruction, or airflow conditions for field review
- procedures that require clearer triggers, ownership, or communication
- planned maintenance windows that need revised load or staffing assumptions
- capacity changes that deserve additional engineering evidence
FactVerse AI Agent can help relate current alarms and trends to asset, event, and maintenance context. Inspector can route approved checks and corrective work to field teams, preserve evidence, and record post-work verification. Any control or operating change follows the facility owner's authorized engineering and change-management process.
Buyer evaluation questions
Scenario credibility
- Which failure, degradation, and recovery states were selected, and why are they credible?
- Which component, dependency, control state, and time sequence does each scenario represent?
- Are the starting load and thermal conditions representative of the reviewed risk?
Evidence quality
- Which geometry, equipment, sensor, alarm, and maintenance records support the baseline?
- Which measurements were used for calibration, and which evidence was reserved for validation?
- How do residuals vary across racks, loads, cooling states, and transition periods?
- Which assumptions have the greatest influence on affected zones or time-to-limit?
Decision fit
- Which threshold and response decision does the study support?
- Are ranges and conservative cases visible beside central estimates?
- Which findings remain stable across plausible scenarios?
- Which engineer approves the evidence and owns the resulting procedure or action?
Operational handover
- Can findings be linked to racks, cooling assets, sensors, inspections, and work orders?
- Are monitoring priorities and response triggers clear to operators?
- Is post-maintenance or post-change verification defined?
- Which facility changes trigger model and evidence review?
Start with one credible disturbance
A focused pilot can use one representative room, one cooling disturbance, and one operating decision. The team establishes a measured baseline, records the facility and load model, defines normal and degraded states, agrees on review thresholds, and compares affected zones, thermal margin, temperature rise, and response timing.
Strong pilot acceptance criteria include:
- a reproducible normal-state baseline tied to current facility evidence
- an unambiguous degraded or unavailable cooling scenario
- transparent assumptions, equipment states, loads, and controls
- rack-level metrics and time-dependent results tied to agreed thresholds
- residual, uncertainty, and sensitivity review proportionate to the decision
- an approved response or monitoring decision with named ownership
- a reusable handover package for future rooms, loads, or cooling states
Explore Data Center Operations for the complete operational and project-enabled workflow. For the rack-level foundation, read Rack-Inlet Temperature and Thermal Margin.
When the decision involves new rack load, density, containment, or room layout, continue with Load Growth and Capacity What-If Analysis.
Public references
The ASHRAE Data Centers and Telecommunications Facilities handbook chapter explains equipment inlet environmental conditions, airflow demand, recommended ranges, and facility cooling considerations.
The United States Department of Energy guide to cooling water efficiency opportunities for federal data centers describes the importance of airflow characteristics, hot and cool zones, and limiting the mixing of warm exhaust with cool inlet air.
The Department of Energy Best Practices Guide for Energy-Efficient Data Center Design covers environmental conditions, air management, cooling systems, measurement, and design practices relevant to facility resilience studies.