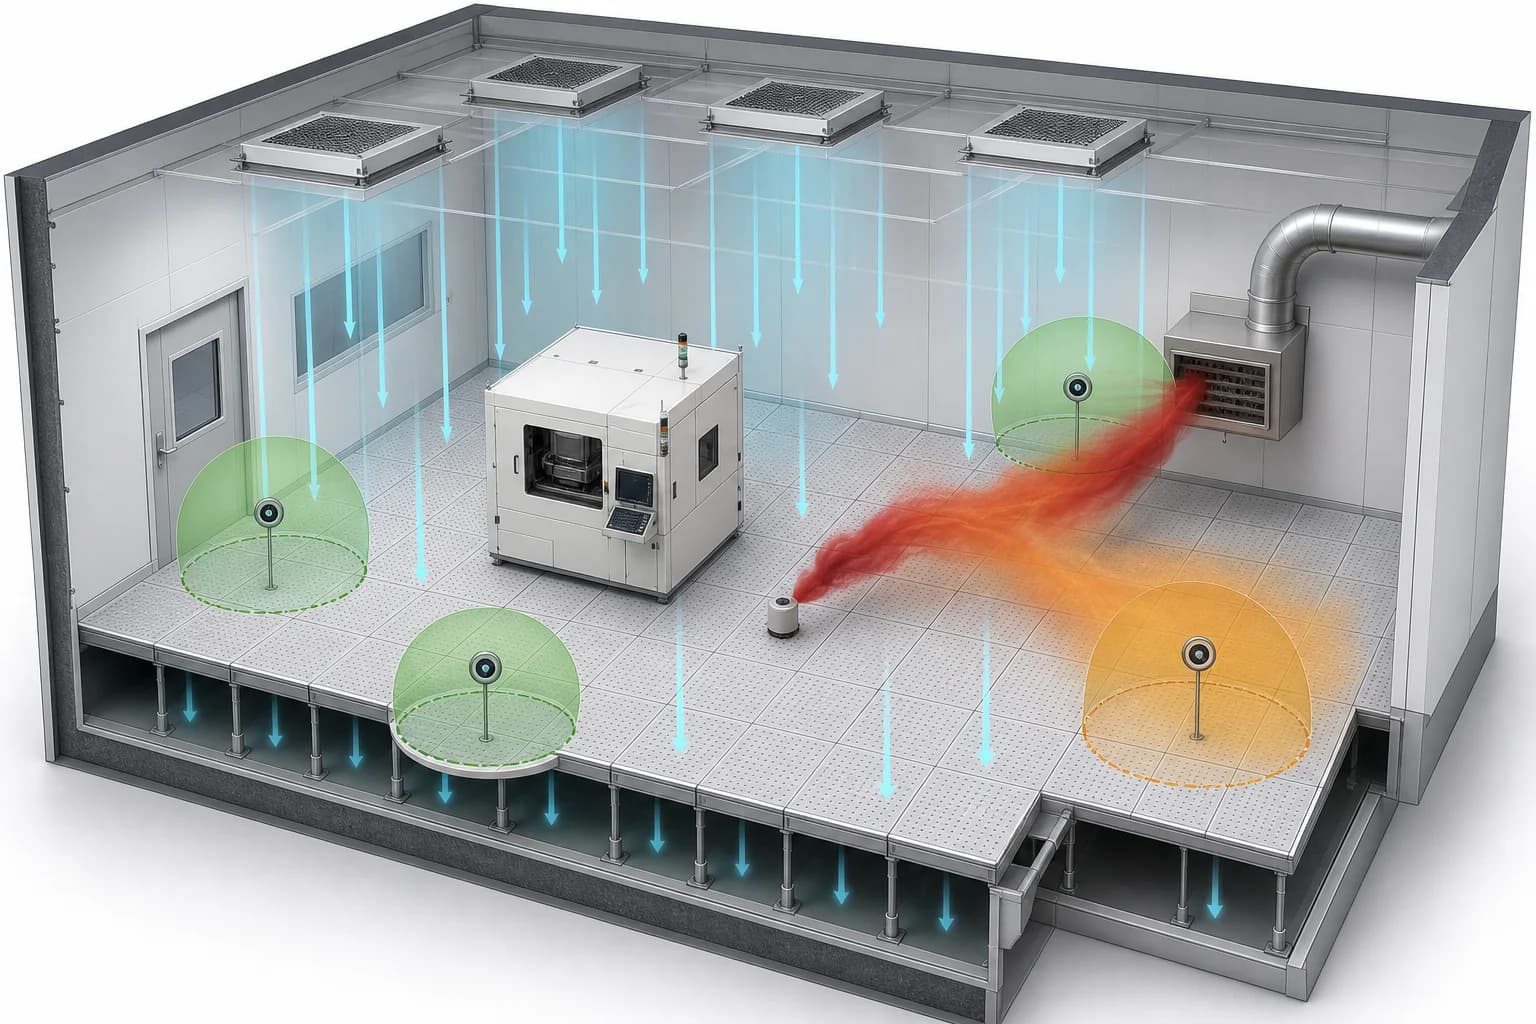
One run shows one path through the assumptions
Industrial systems operate across changing loads, weather, equipment states, control modes, material properties, and human actions. A single simulation run can explain one defined condition. Resilience and safety decisions usually need a wider view: which findings remain stable, which inputs drive variation, and which credible conditions bring the system closest to an operating limit.
A scenario ensemble provides that wider view. It organizes multiple runs around a clear decision and turns their outputs into distributions, comparisons, sensitivities, and conservative review cases.
The objective is practical engineering judgment. Buyers should be able to see how much of the relevant operating space was explored, where the evidence is strong, where the result is sensitive, and which action deserves priority.
Build scenario families before choosing run counts
A scenario family is a structured set of conditions selected because they matter to the decision. The team defines engineering coverage first and then chooses the run design needed to examine it.
Typical scenario dimensions include:
| Dimension | Examples |
|---|---|
| Demand and load | IT load, production rate, building heat demand, packaging rate, robot task frequency |
| Equipment state | Normal operation, degraded fan or pump, unavailable cooling unit, reduced exhaust, sensor outage |
| Environment | Outdoor temperature, humidity, wind, severe weather, room boundary condition |
| Source condition | Release location, heat source, contamination source, material entry point, disturbance timing |
| Control and response | Setpoint, sequencing, preheating strategy, alarm delay, operator response, recovery action |
| Asset and material | Geometry variant, friction, mass, thermal property, resistance, leakage, equipment performance |
The team should explain why each dimension is present, which values are credible, and how the selected combinations cover the decision. This makes scenario coverage reviewable before computation begins.
Separate scenario variation from repeated sampling
Two types of multi-run analysis answer different questions.
Scenario-family comparison
Scenario-family runs change named engineering or operating conditions. Examples include normal and degraded cooling, several cleanroom release locations, severe-weather heat demand, or alternative production layouts.
The output answers questions such as:
- Which condition creates the smallest thermal margin?
- Which detector placement leaves the largest blind region?
- Which network zone remains sensitive during severe weather?
- Which layout or task sequence creates repeated collision or access risk?
Repeated runs within a scenario
Repeated runs examine variation inside one defined scenario. The varying inputs may represent measurement uncertainty, natural process variability, uncertain material properties, stochastic release behavior, random task initialization, or sampling of a defined parameter distribution.
The output answers questions such as:
- How widely does time to an agreed limit vary?
- How stable is a detector-response finding across plausible source behavior?
- Which parameter contributes most to the spread in the result?
- How often does a metric exceed the review threshold inside the sampled study design?
Many evaluations use both. Scenario families establish engineering coverage, and repeated runs characterize variation within selected high-impact scenarios.
Read distributions in customer language
An ensemble replaces one result with a range of outcomes. Buyers can ask sound questions about that range using a small set of practical measures.
| Measure | What it tells the reviewer | What to inspect beside it |
|---|---|---|
| Minimum and maximum | The observed range across included runs | Outliers, sampling coverage, physical credibility, and whether the extremes were resolved sufficiently |
| Median | A central outcome with half the runs above and half below | Distribution shape, sample count, multimodal behavior, and decision relevance |
| Percentile | A value below which a stated share of included results falls | Selected percentile, tail sample count, input distributions, and consequence of exceedance |
| Exceedance rate | The share of included runs crossing an agreed threshold | Threshold basis, scenario weights, representativeness, validation, and sampling error |
| Spread or interval | The amount of variation across results | Dominant inputs, data quality, model uncertainty, and unresolved conditions |
| Sensitivity | Which input changes have the greatest effect on the decision metric | Input range, interactions, physical plausibility, and opportunities for better measurement or control |
Every measure remains conditioned on the scenarios, input ranges, distributions, model, and sampling design used. The review package should show those conditions next to the summary result.
Use comparison visuals to expose scenario logic
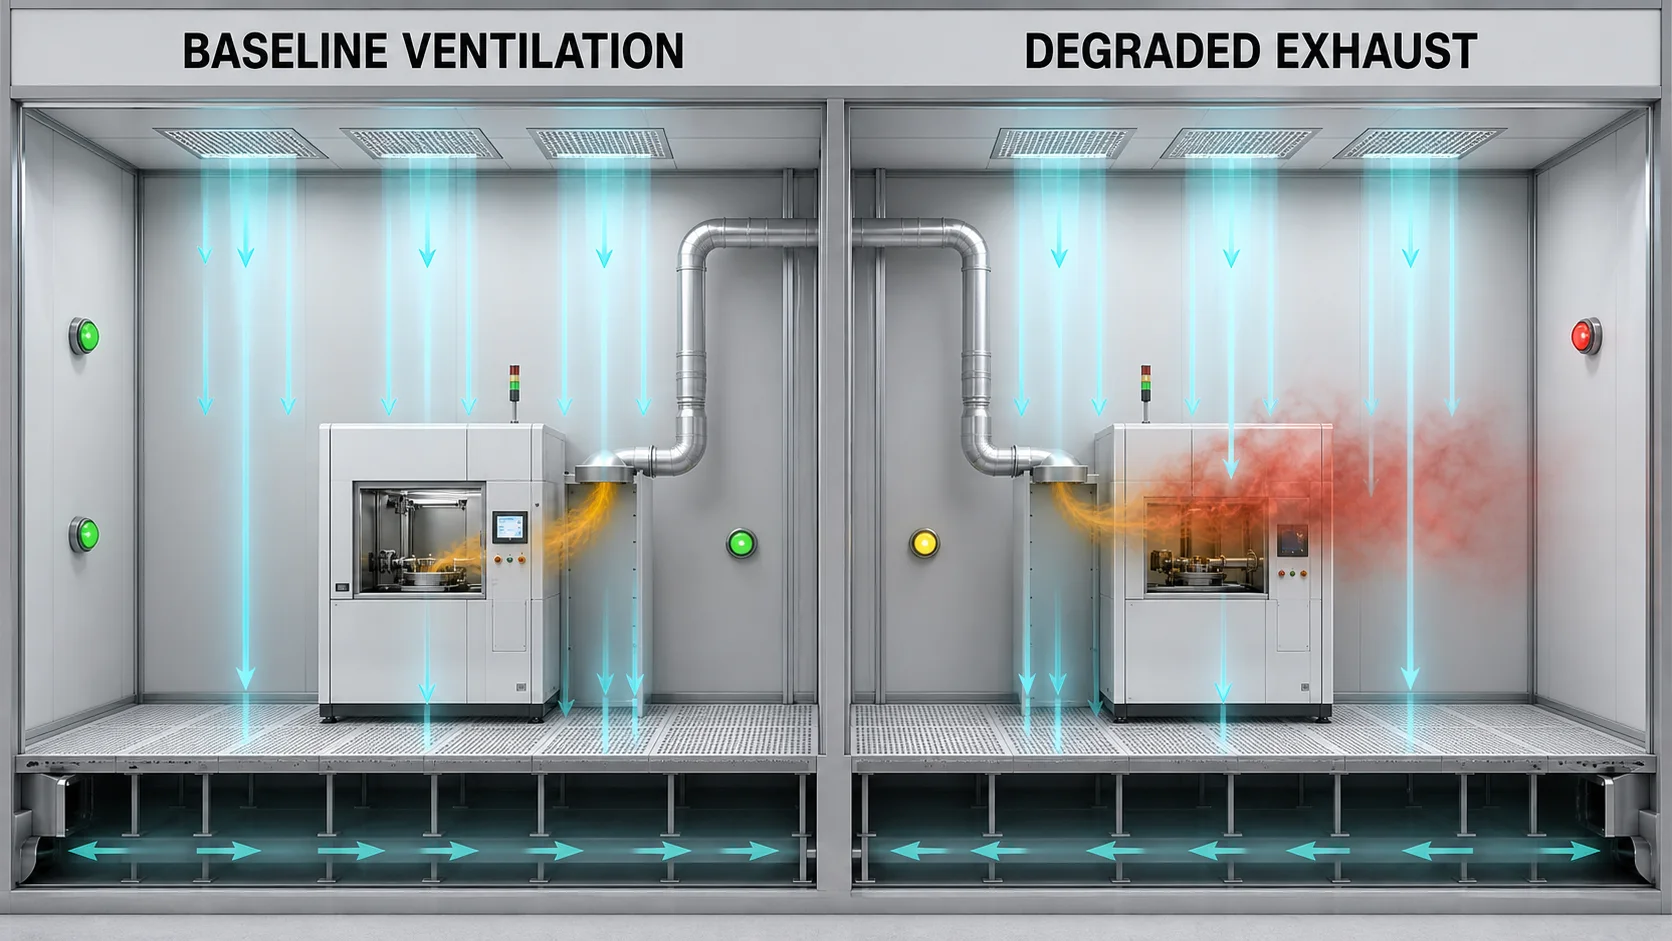
A visible baseline-to-degraded comparison helps stakeholders confirm which condition changed before they interpret the resulting field, metric, or action.
Useful comparison views include:
- baseline and degraded-condition fields shown with the same scale
- spatial maps of margin, exceedance, detection coverage, or collision frequency
- time-series bands across repeated runs
- distributions of time to a limit or response event
- sensitivity rankings for influential inputs
- scenario matrices showing conditions, findings, severity, and action ownership
Consistent scales and units matter. Changing a color range between panels can make small differences appear dramatic or hide meaningful deterioration.
Define conservative review before seeing the answer
Conservative review selects evidence that gives appropriate weight to adverse credible outcomes. The method should follow the consequence of error and be agreed before the final result is known.
Common approaches include:
- reviewing the most adverse physically credible scenario
- selecting an upper or lower percentile for the decision metric
- preserving an explicit margin from an operating limit
- using a confidence interval around the selected percentile or exceedance rate
- requiring stability across multiple model assumptions or data periods
- escalating any scenario that crosses a safety, service, quality, or equipment threshold
- combining quantitative results with domain-expert review of unmodeled conditions
The selected approach should state the protected outcome, the covered conditions, the evidence quality, and the responsible reviewer. A high percentile from a narrow scenario set can still leave important operating conditions unexplored.
Apply ensembles to resilience and safety questions
Data-center thermal resilience
A useful family can vary IT load, cooling-unit availability, containment condition, supply temperature, fan behavior, and recovery timing. Review metrics can include rack-inlet margin, hotspot location, rate of temperature rise, and time to an agreed limit.
The buyer should look for scenario coverage across credible degraded states and growth conditions. Conservative review may focus on time margin for action and the racks or zones that repeatedly become critical.
Cleanroom airflow and detection assurance
A cleanroom family can vary release location, source behavior, local exhaust condition, facility ventilation state, door condition, and detector placement. Repeated runs can explore uncertain source timing, strength, or direction.
Review metrics can include detection time, undetected region, local exhaust capture behavior, concentration at agreed locations, and sensitivity to degraded ventilation. The study should preserve safety ownership and site-specific validation requirements.
District-heating planning
A district-heating family can vary outdoor temperature, building demand, wind, network condition, pump and valve strategy, source availability, and preheating timing. Review metrics can include service condition by zone, return-temperature behavior, imbalance, pressure margin, and recovery after a disturbance.
Conservative review can highlight weather and demand combinations that leave the least operating margin and identify where better measurements or targeted balancing studies add the most value.
Production and robotics
A production family can vary layout, package type, friction, speed, buffer state, task timing, robot initialization, and equipment availability. Review metrics can include completion, collision, handoff stability, clearance, queueing, recovery behavior, and task variation.
For Physical AI work, repeated simulation can also support policy training and evaluation. The evidence package should keep training variation, evaluation scenarios, sim-to-real checks, and acceptance criteria clearly separated.
Check whether the ensemble is large enough
Run count follows the decision metric, variability, tail behavior, and required confidence. A fixed number has little meaning without convergence evidence.
Buyers can ask:
- Does the median or selected percentile stabilize as runs are added?
- Are tail cases represented by enough samples for the intended decision?
- Have important scenario dimensions and interactions been covered?
- Are rare but credible engineering conditions represented deliberately?
- Does additional sampling materially change the finding or priority?
- Are computational shortcuts, surrogate models, or reduced-order methods validated for the intended metric?
The project can show convergence plots, interval width, repeated batches, or holdout comparisons according to the method. High-consequence probability statements require deeper statistical design and review than relative scenario prioritization.
Find the inputs that deserve attention
Sensitivity analysis connects output variation to input variation. It helps teams identify which measurements, controls, assets, or assumptions have the greatest effect on the decision metric.
This creates practical value:
- prioritize sensors where uncertainty changes the decision
- focus calibration on influential physical parameters
- identify controls with meaningful operating leverage
- narrow low-value scenario dimensions
- reveal interactions that need a combined scenario
- direct detailed engineering or physical tests toward the largest evidence gap
Sensitivity should be evaluated across credible input ranges. A parameter can appear unimportant when the chosen range is too narrow or when an interacting condition is absent.
Preserve review ownership
An ensemble can produce many plots and summary statistics. The evidence remains actionable when responsibilities are explicit.
The review record should name:
- the owner of the decision question
- the engineer responsible for scenario coverage
- the owner of operational and measurement data
- the analyst responsible for model and sampling choices
- the domain reviewer responsible for physical interpretation
- the safety, quality, operations, or engineering authority responsible for action approval
Findings should connect each adverse or sensitive condition with a proposed action, priority, owner, and required follow-up evidence.
Buyer checklist for scenario coverage
Decision and consequence
- Is the protected outcome clear?
- Is the consequence of threshold exceedance understood?
- Is the selected conservative review rule agreed in advance?
Scenario design
- Which loads, environments, equipment states, controls, and disturbances are included?
- Why are the selected values and combinations credible?
- Which conditions remain outside the study?
- Are baseline, degraded, recovery, and growth conditions represented where relevant?
Sampling and uncertainty
- Which inputs are fixed, deliberately varied, or sampled from a distribution?
- Where did each range or distribution come from?
- Are median, percentile, exceedance, and interval estimates supported by adequate sampling?
- Which inputs dominate variation in the decision metric?
Evidence and action
- Are visual comparisons shown with consistent units and scales?
- Which findings remain stable across plausible variation?
- Which adverse cases require measurement, calibration, detailed engineering, testing, or operational action?
- Who reviews and approves each conclusion?
Choose the next evaluation step
Use a scenario-design workshop when operating conditions, disturbances, decision metrics, and review ownership still need alignment.
Use a sensitivity study when the team needs to identify influential data, parameters, and controls before committing to a larger ensemble.
Use an ensemble pilot when the buyer needs to prove run orchestration, data readiness, result aggregation, and review workflow for one decision.
Use a calibration or validation study when site-specific magnitude, timing, margin, or probability requires stronger evidence. The calibration levels and claim confidence guide explains how to match conclusions to that evidence.
Use the simulation evidence evaluation guide to review the complete chain from intended use and inputs through metrics, findings, actions, and approval.
How DataMesh supports scenario review
FactVerse Designer prepares reusable scenes, operating states, behavior, and scenario variants. Data Fusion Services connects operational history, measurement identity, quality context, and time alignment. DataMesh project workflows can preserve run identity, fields, metrics, findings, actions, and review ownership across scenario families.
Explore Process Simulation and Virtual Planning, Data Center Operations, Semiconductor Facility Operations, and Smart District Heating for market-facing examples of decisions that can benefit from structured scenario comparison.
Public references
NASA's public Modeling and Simulation definitions define scenarios, sensitivity analysis, uncertainty characterization, and result robustness in the context of model-based decisions.
The American Society of Mechanical Engineers introduction to uncertainty quantification describes a cycle of characterizing uncertainty, propagating it through the model, interpreting results, and identifying influential uncertainties through sensitivity analysis.
The National Institute of Standards and Technology overview of virtual measurement describes uncertainty quantification as the characterization and communication of incomplete knowledge affecting numerical simulation outputs.
NASA's public guidance on modeling and simulation use asks whether data pedigree is adequate, how uncertainty propagates into results, and how thoroughly result sensitivities are understood.